Bearish Momentum Starting to Take Hold of BTC-USD

BTC-USD is hardly changed on today’s open, currently trading 0.18% higher on the BitStamp exchange, but as the chart below illustrates, it looks as if sellers are gaining the upper hand as they look to take the price action lower. The 4-hour chart below shows that the price action has started to move below the Ichimoku cloud, suggesting a strong possibility of a strong downward trend emerging.
Bearish momentum is indicated by the relative strength index and the relative position of the base (dark-red) line with respect to the conversion (blue) line. The relative strength index was flat but now looks to be moving downward and is currently below 50. The base line is trending above the conversion line indicating bearish momentum. The conversion line is currently providing minor support at $414.19 and a close below this level will give further bearish confirmation.
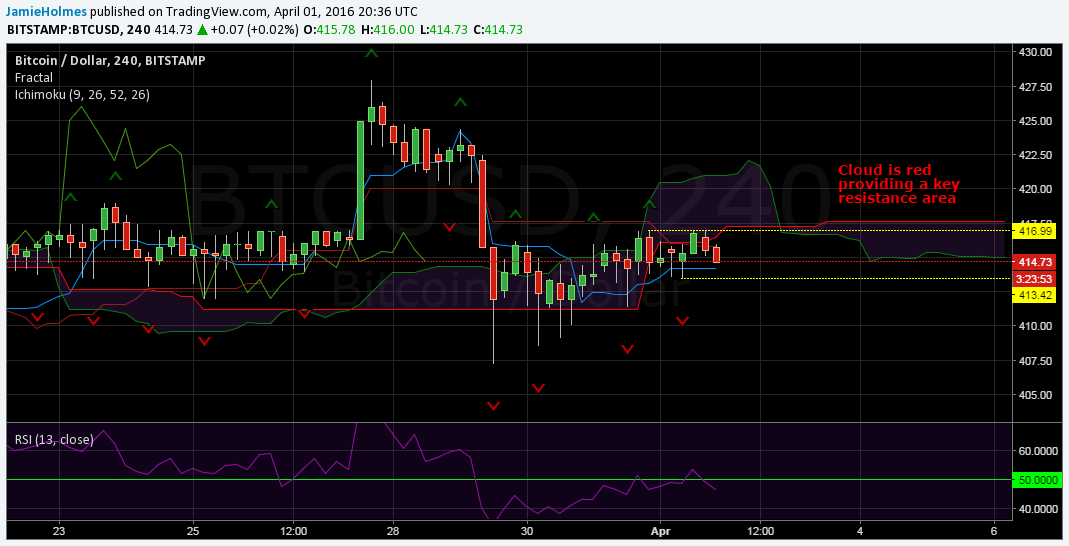
The most recent fractal levels are also indicated on the chart with resistance at $416.99 and support at $413.42. The fractal support at $413.42 will be a key area to watch going forward; if this level holds as support, then we could see the downward move quickly exhausted. If this support is broken, however, then we should see further downside risk to BTC-USD. A bullish outlook will only be validated if there is a close back above the base line currently at $415.79.
The chart below illustrates the longer-term outlook with the daily price action in BTC-USD. The price action so far today has formed a variant of the Doji candlestick, suggesting indecision in the market today. One key thing to notice is that the base line has jumped significantly higher, and if the base line moves above the conversion, then this will give an early indication of an imminent bearish move from the market.
A failure for BTC-USD to close higher than the base line will also give a bearish signal at the end of trading today. Therefore, a close below $415.51 today will mean the downside will be more exposed. However, buyers should look for a close higher than $415.51 today as this will give a strong bullish signal. Immediate resistance is then found at the conversion line at $417.60 today.
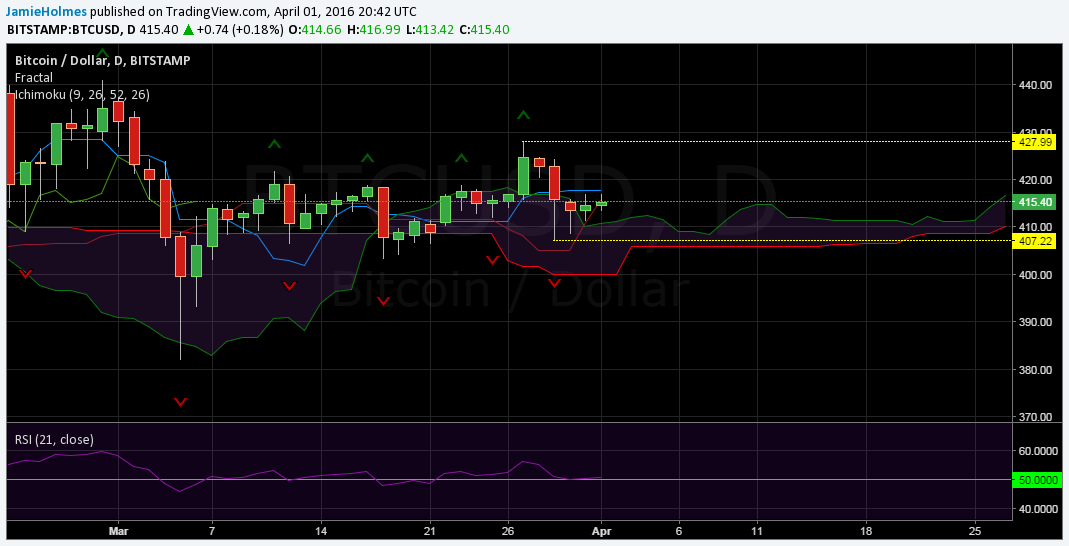
The relative strength index is flat and very close to 50, suggesting the market is in equilibrium on the daily timeframe; this justifies a lower price since the price action is above the cloud. Therefore, we expect that the price will tend to the area of the Ichimoku cloud around $410 and fractal support at $407.22. A break of the support at $407.22 will see sub-$400 exposed. On the other hand, fractal resistance lies at $427.99 and a break above this level should see a move towards $450. However, a break of fractal support looks more likely at the moment, so selling positions are favored over the next few days.