Bullish Momentum Picks Up in BTC-USD

Bullish momentum has picked up in BTC-USD after the market formed a bullish hammer candlestick on Saturday, indicating strong buying interest just above the $400 handle. Yesterday also saw a neutral bullish signal as the market closed above both the base line and conversion line suggesting further appreciation in Bitcoin against fiat currencies is yet to come. The market is very close to fractal resistance at $419.00 and if there is a daily close above this level, then bullish dominance will be anticipated with buyers looking to target fractal resistance $440.99.
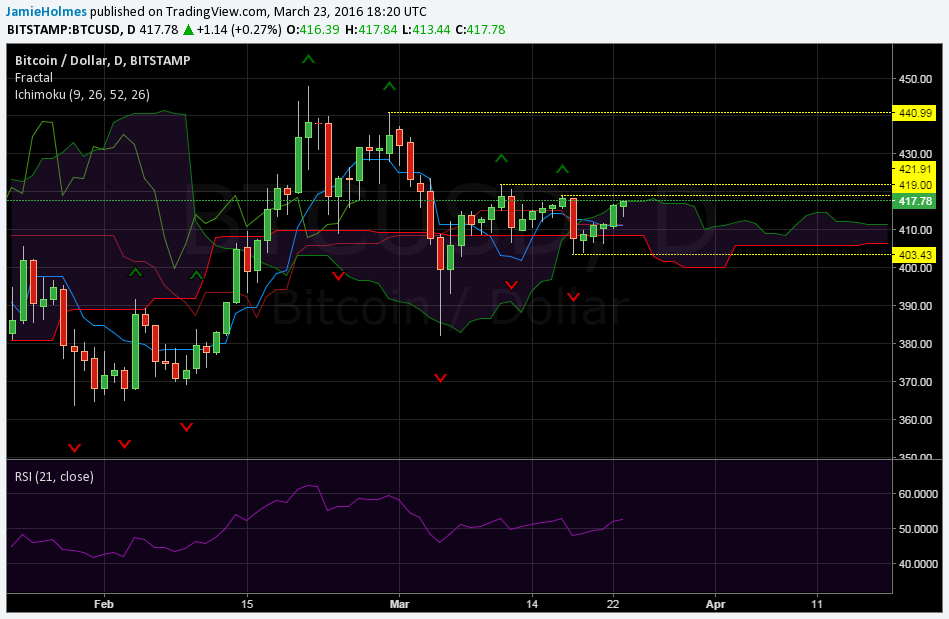
The base and conversion lines both now provide minor support around $411.00 and sellers should look for a close below this level to enter into short positions. The most recent fractal support level lies at $403.43 indicated by the yellow ray on the graph above. A daily close below this level is needed to see the market attempt fresh lows beneath $380.00 in the long-term. Another important level is $421.91 which provides immediate resistance if the $419.00 level is broken.
Momentum, as indicated by the relative strength index, is illustrating a slight upper-hand for bulls in the market as the index has moved above 50 recently and looks to be continuing the upward trend. The price action is also still contained within the Ichimoku cloud and if the relative strength index continues higher above 60, then we should see an Ichimoku cloud price breakout with the market tending towards $450.
The shorter-term outlook is illustrated by the hourly chart below and shows how the market moved above the Ichimoku cloud and buyers took control pushing the price from around $405 to just under $420 at present. The base line and conversion lines have converged suggesting that the price action will most likely range over the short-term. However, the market is currently above the most recent fractal resistance ar $417.48 and an hourly close above this level will provide a bullish outlook in the short term. Conversely, an hourly close below $413.44 will provide a bearish outlook.
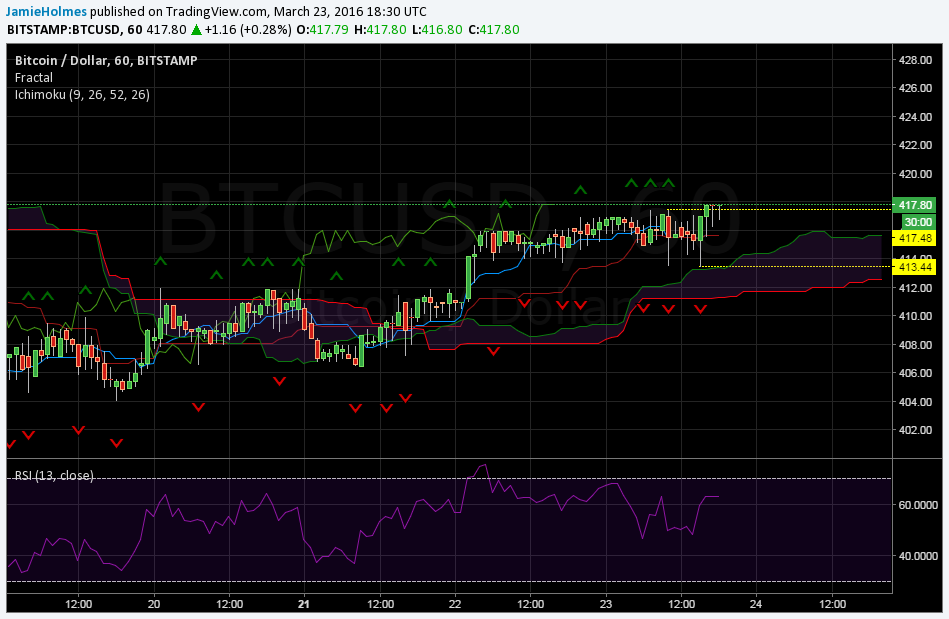
The relative strength index also supports a bullish outlook over the short-term and sellers will only dominate in the short term if the market moves below support provided by the base line currently at $415.64. Further bullish indication will be given when the base or conversion lines start to trend upwards or if the conversion line starts to move above the base line. On the other hand, an early warning signal of bearish pressure will be given if the conversion line starts to trend downwards and moves below the base line. This will indicate bearish momentum and will most likely see the price action follow the conversion line downwards. However, as it stands now, we should see more bullish behavior from market participants over both the short and long term.