ETH-USD Bouncing Upward From Psychological $7 Handle
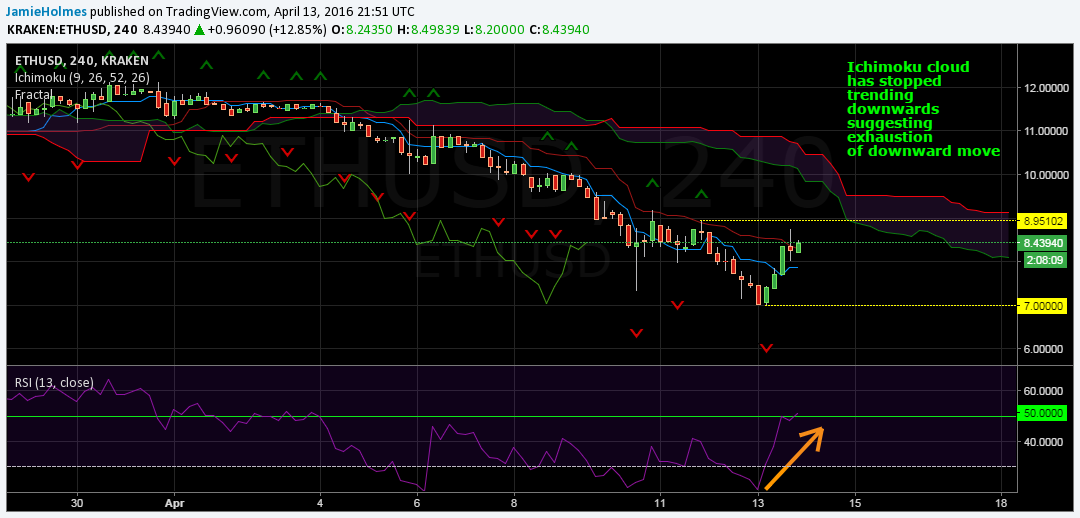
After extending further below the $8 level to establish a fractal support at $7, ETH-USD has bounced back and is trading high today; the market is looking to breach $9 with immediate fractal resistance at $8.951. On the Kraken exchange, the price of Ether against the U.S. Dollar is 12.85 percent higher than today’s opening price. The chart below illustrates the medium-term outlook for ETH-USD with the 4-hour price action and several indicators.
The first thing to notice is that the market is still below the Ichimoku cloud, suggesting sellers are still in control, but there seems to be a weakening in their dominance of the market; the Ichimoku cloud has stopped trending downward and has moved sideways, suggesting an exhaustion of the current downward momentum. A bullish indication has been given recently as well, as the price action closed above the conversion (blue) line; the conversion line will now offer support currently at $7.875. Further indications of bullish momentum will be given when the Ichimoku cloud turns green and when the conversion line moves above the base (dark-red) line. On the other hand, sellers looking for a higher likelihood of a downward move should wait for the market to close below the conversion line.
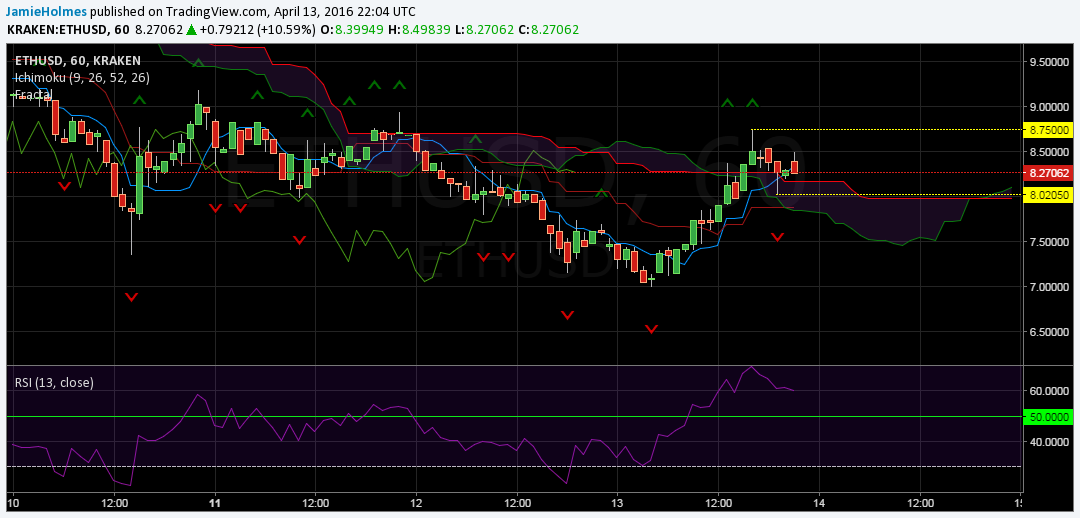
The market is now testing the base line which is still offering resistance currently at $8.3099. It is currently trading above this level, but we need a 4-hour session close and the candlestick representing that trading session to close above this level. This would signal bullish momentum and would see the market extend toward the Ichimoku cloud, which offers the next resistance area. Notice in the immediate 4-hour sessions ahead that the Ichimoku cloud is very thin, suggesting only very weak resistance in this area over these time periods; buyers should look for a breakout from the Ichimoku cloud where the market closes above the cloud, generating a buy signal.
On one hand, the market has broken above the Ichimoku cloud and it has changed color from red to green, two bullish indications. However, the relative strength index is trending downward, implying that the market will tend toward the Ichimoku cloud, and the market looks to be moving below the conversion line which will give a bearish signal. An extended upward move is expected if the conversion line holds as support and is currently at $8.33; going forward we need the hourly closing price to be above this level for a bullish outlook, otherwise sell positions are optimal.