Pessimism Among Stock Investors Sparks Momentum Reversal in BTC-USD

BTC-USD is up almost 2.0% on today’s open as stocks continued falling globally, especially European indices. After a few days of relative tranquility, volatility has returned to the markets with the price action posting a fresh high of $383.85 today. One key event that could generate even more volatility in the markets is today’s testimony before Congress by Jane Yellen of the U.S. Federal Reserve. What she emphasizes will be key for the U.S. Dollar going forward, and consequently BTC-USD.
If she states that the U.S. economy is returning to full employment and is more concerned about inflationary pressures, this would be indicative of at least one more interest rate hike this year. This scenario would be bullish for the U.S. Dollar and bearish for BTC-USD. On the other hand, if she emphasizes deflationary pressures such as slowing growth in China and stubbornly low oil prices, then this scenario will signal that the central bank will probably hold off on raising interest rates, which is bearish for the U.S. Dollar ,and subsequently bullish for BTC-USD.
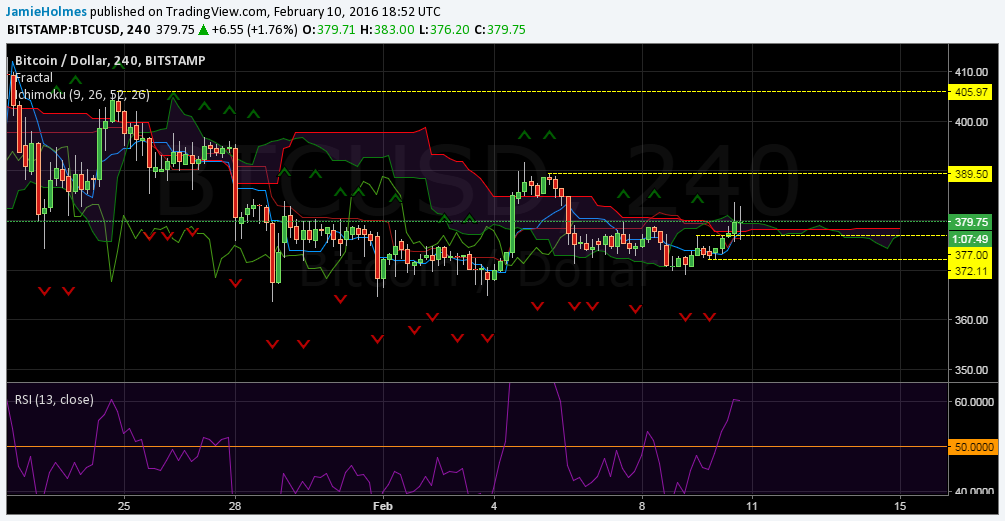
The chart below shows the 4-hour price action, illustrating the outlook over the medium term. The price action is currently attempting to break above the Ichimoku cloud and if there is a close above this level, then this will generate a bullish signal; this is also supported by the relative strength index which has moved above 50. The most recent fractal resistance at $377.00 has been broken, pointing to further gains. The next fractal resistances to watch out for are at $389.50 and $405.97.
Conversely, a bearish outlook is only validated if the price fails to break above the Ichimoku cloud and there is a sustained move below the most recent fractal support at $372.11. This will see sellers target $364.70 and the psychological $350 handle. Moreover, a close below the base line will indicate a shift to bearish momentum and provides minor support going forward, currently at $376.48.
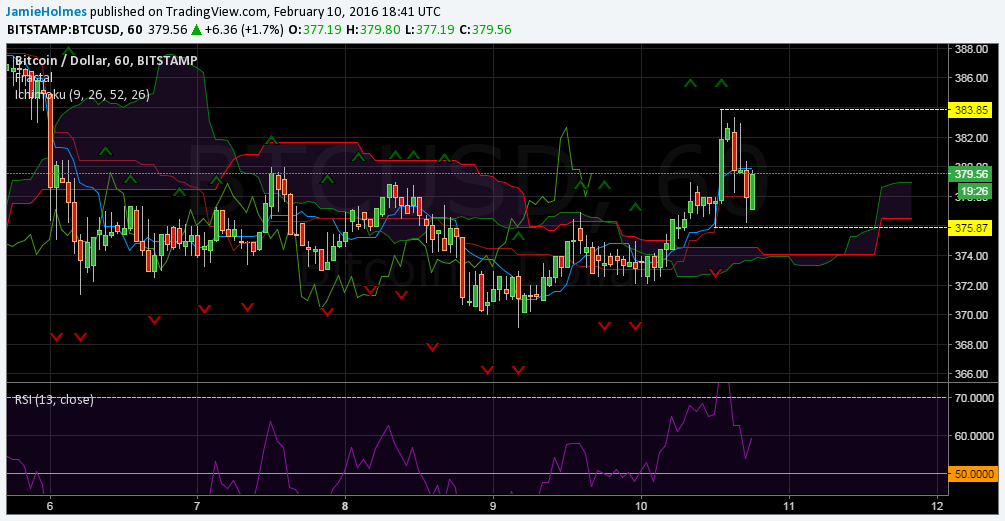
The short-term outlook is shown below and illustrates a bullish picture. First, the price action is above the Ichimoku cloud suggesting a short-term uptrend is in place. Second, the conversion (blue) line has moved back above the base (dark-red) line, indicating bullish momentum. Finally, the relative strength index also confirms this as the index is above 50. The most recent fractal levels are indicated on the graph by the yellow rays. A close above $383.35 will see an attempt at $400 whereas a close below $375.87 will probably manifest itself as another move below the Ichimoku cloud towards $350.