Price Analysis: ETH-USD Looking for Another Attempt at $15?
The market looks ready to gear up for another bullish run with the price action contained within a tight range between fractal support and resistance. The chart below shows the daily price action, and the market has recently moved above the conversion (blue)line which is now providing minor support. This represents a strong bullish signal. Furthermore, the conversion line has started trending upward, also giving a bullish indication, and has provided support today at $11.30. It should continue to hold as support in the days ahead and represents a good buying opportunity if the market tests the minor support at the conversion line.
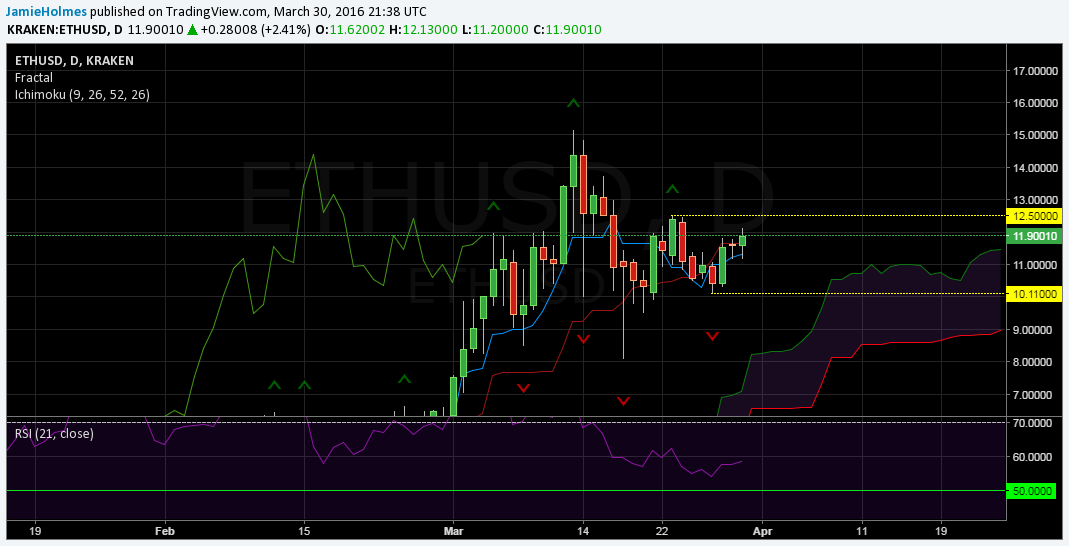
A further bullish indication will be given today if the market manages to close above the base (dark red) line at $11.6356. If the market closes above this level, then this will increase the likelihood of further appreciation. If the base line holds as resistance, then we should look for the market to move toward fractal support at $10.11 as indicated on the chart by the yellow ray. However, if this resistance is broken today, we should see the market tend toward fractal resistance at $12.50, the most recent sell fractal, as indicated by the other yellow ray.
A market break above the fractal support at $12.50 should see the market test the all-time high around $15, whereas if the market manages to plunge below $10.11 then the Ichimoku cloud should provide support. This is illustrated by the chart above which shows a critical support area spanning between $11.00 and $9.00 which will see heightened buying interest. However, if the market maintains below the Ichimoku cloud, then the long-term outlook will switch from bullish to bearish. However, as it stands the outlook is very bullish on the daily timeframe with the market more likely to tend toward $12.50 before reaching $10.11. The relative strength index is comfortably above 50, an indication of bullish momentum.
The shorter-term outlook is shown below by the 4-hour chart and shows that the market has closed higher than the most recent sell fractal at $11.80 twice now. Therefore, we should see bullish momentum continue to dominate; furthermore, the Ichimoku cloud has changed from red to green recently and the price action is above the cloud, suggesting buyers are in control. A bearish outlook is only validated if there is a close below the conversion line which is currently acting as minor support at $11.665. The Ichimoku cloud is only providing weak support around $11.00 as indicated by the extremely thin cloud on the chart in the early hours of Friday. However, the relative strength index is trending downward, but the outlook should remain bullish if the index remains above 50.
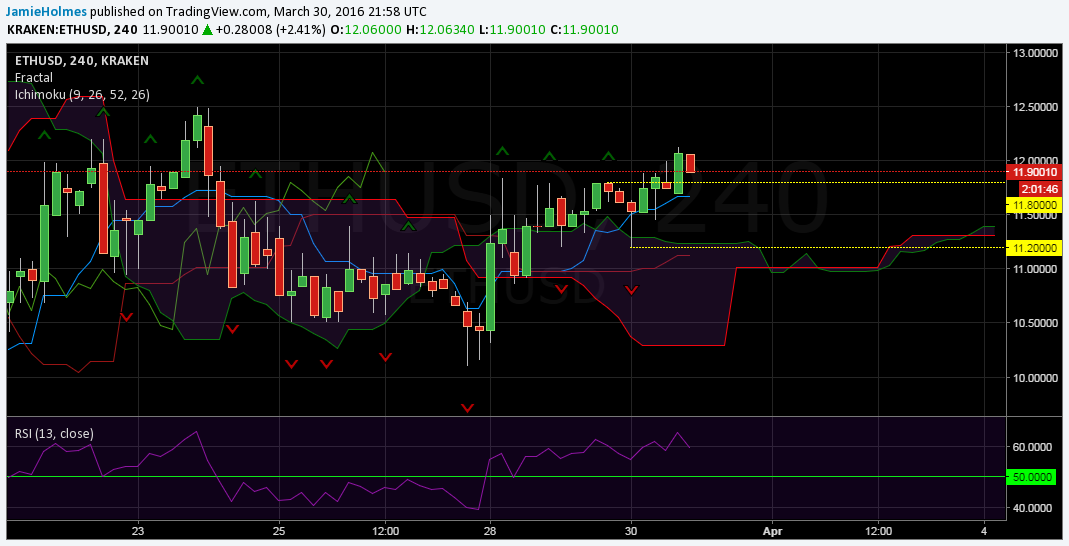
The lagging line is also above the cloud which is confirming an upward trend in the market. An early indication of weakening bullish momentum will be given if the lagging line starts to trend in the Ichimoku cloud area again. A break below fractal support at $11.20 will see increased bearish momentum. Also, the recently broken fractal resistance, now turned support, at $11.80 is a critical level to keep an eye on. If this level fails to hold as support then any buying opportunities over the short-term may not be optimal and selling may be not as risky.