

Price Analysis: Sellers looking to bring BTC-USD to $350

This week saw two major central banks take a pessimistic stance, with the Bank of Japan implementing negative interest rates and the Federal Reserve in the U.S. stalling and maintaining the base rate at 0.5%. ‘Risk-on’ sentiment dominated markets as Japan’s central bank moved rates into negative territory, boosting global stock indices, while Bitcoin moved from a low of $363.73 to a high of $383.99. Selling interest around this level, just below the important fractal resistance level at $384.39, has brought the price action to $376.99 at the time of writing.
A move away from safe havens such as JPY and CHF by investors may explain why BTC-USD has suffered. Also, the Federal Reserve mentioned it will be monitoring global economic and financial developments; delaying further rate hikes has also supported risk-on sentiment recently, driving money out of assets favored during periods of risk-off sentiment such as gold, Bitcoin and JPY.
Sellers seem to still be in control of BTC-USD as the chart below illustrates. It shows the daily price action on the BitStamp exchange. The price action is below the Kumo suggesting a bearish outlook over the long-term, as well as by the red Ichimoku cloud, or Kumo, and relative positions of the conversion (blue) and base (dark-red) lines.
The targets for sellers are indicated at the fractal supports at $348.64 and $294.00. Yesterday’s price action is illustrated by a bearish Dragonfly Doji candlestick pattern and indicates a high probability of a continuation of the current downward trend. Moreover, a move below the Ichimoku cloud for the lagging line looks imminent and will give strong confirmation that a long-term downward trend is developing.
Buyers should look for a close above the conversion line, which is currently providing minor resistance at $386.90. A daily close above the conversion line should see bullish momentum extend to fractal resistance at $422.98. A break above this level is needed to validate a bullish outlook over the long-term.
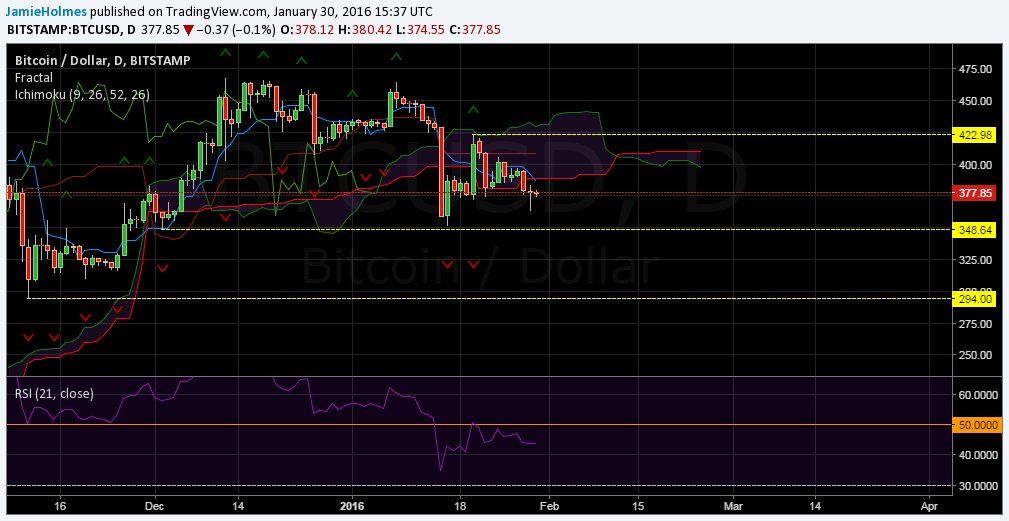
The relative strength index is below 50 which also gives further bearish confirmation and is not yet approaching the oversold region just yet, indicating that there is plenty of room for BTC-USD to move lower. Buyers should wait for the relative strength index to move below 30 to look for buying opportunities. Also, a move back above the 50 level would also present a buying opportunity, signalling a shift in momentum.
The chart below shows the short-term outlook with the hourly price action on the BitStamp exchange. The most recent fractal levels are indicated on the chart and shows that the price action is within the Ichimoku cloud, suggesting the market is in equilibrium at the moment. Therefore, a breakout is expected soon, more likely to the downside. The price failed to break above the Ichimoku cloud suggesting sellers are still in control.
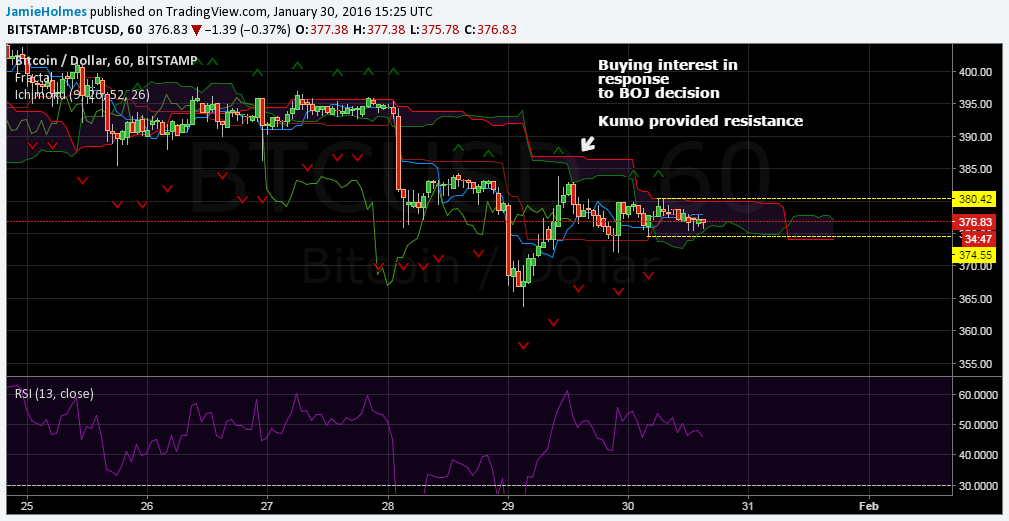
The relative strength index is below 50 and a break below the most recent buy fractal at $374.55 should see bearish momentum extend to recent lows around $365 and a test of fractal supports around $350. A bullish outlook is only validated in the short-term is we see a sustained move above the fractal at $380.42.