Bitcoin
Bitcoin (BTC)
$97,884.00 3.51346
Bitcoin price
Ethereum
Ethereum (ETH)
$3,346.33 8.56903
Ethereum price
BNB
BNB (BNB)
$621.06 1.60754
BNB price
Solana
Solana (SOL)
$253.95 6.77298
Solana price
XRP
XRP (XRP)
$1.18 7.16721
XRP price
Shiba Inu
Shiba Inu (SHIB)
$0.0000245 1.709
Shiba Inu price
Pepe
Pepe (PEPE)
$0.0000207 9.08424
Pepe price
Bonk
Bonk (BONK)
$0.0000527 2.0909
Bonk price
dogwifhat
dogwifhat (WIF)
$3.22 3.64575
dogwifhat price
Popcat
Popcat (POPCAT)
$1.57 1.13288
Popcat price

Ethereum total gas usage just hit a 4-month low amid a price slump

ethereum-total-gas-usage-just-hit-a-4-month-low-amid-a-price-slump
Edited by
News
Ethereum total gas usage just hit a 4-month low amid a price slump

The ethereum network is witnessing a drastic reduction in the amount of gas used, as total gas usage recently plummeted to 4,507,912,628 – a low last witnessed in October 2022.

This gradual reduction in gas usage comes amidst the market-wide correction that has battered ethereum (ETH) below $1,600.

The previous 4-month low was observed on Feb. 8, according to data from a Glassnode chart shared earlier today. The blockchain data provider revealed that since reaching a peak a few weeks after the Merge last year, the ethereum gas usage has continued to decline, persistently hitting lower lows of late.

https://twitter.com/glassnodealerts/status/1625347984211714048?t=7AizD1Am4FQiRifBI-7Z4A&s=19

Although gas usage has not plummeted below the 4.5 billion mark since October, if the current rate of decline persists, the network could see a break below this level. Historically, a decrease in gas usage suggests there is currently less demand for computational resources on the network. This could indicate a decrease in transaction volume or a shift in user behavior away from gas-intensive activities such as decentralized finance (DeFi) trading.

Ethereum faces bearish opposition 

This steadfast decline comes on the heels of the latest market-wide opposition recently engineered by the bears, to which ethereum has not been immune. The asset has declined by 7.79% in the past week after registering two consecutive losses in the last 2 days.

Ethereum’s largest intraday loss for this year occurred on Feb. 9, after gas usage hit a 4-month low the previous day. The asset shed up to 6.37% of its value on that day, breaking below the $1,600 mark. ETH has continued to trade below the price territory, with the bears looking to batter the asset further below the $1,500 level. The asset is currently changing hands at $1,503.
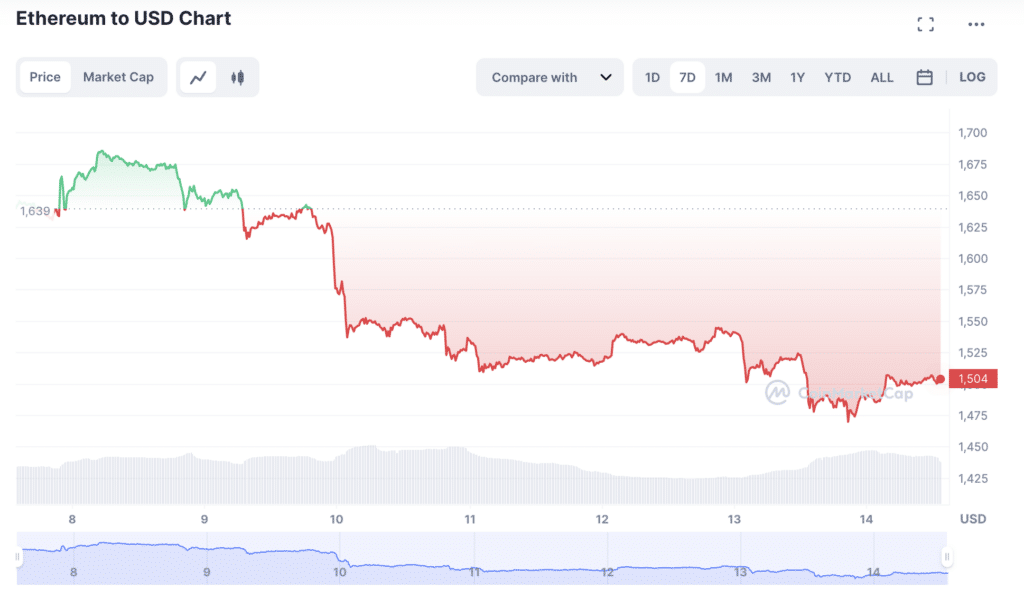
Ethereum price chart (7 days). Source: CoinMarketCap

Amid these unpropitious price movements, investors have been steadily sending their ETH tokens to exchanges – a behavior that often signals an intent to sell. The CryptoQuant Exchange Netflow metric reveals that net deposits of ETH are higher than the 7-day average. 

Moreover, the blockchain tracking system Whale Alert recently highlighted that a large ETH whale address, with a balance of 100 ETH, was just activated after seven and a half years of remaining dormant. 

https://twitter.com/whale_alert/status/1625337607021379587?t=sV1Q3Un-Lfvwun493PeQXA&s=19