Robinhood stock price soars to new peak: Time to buy or sell?

Robinhood’s stock price has surged for nine consecutive weeks and is now hovering at its highest level on record.
Robinhood, whose ticker symbol is HOOD, rose to nearly $92, up 200% from its April lows and 1,042% from its lowest point in 2023. Its market capitalization has jumped to over $77 billion.
HOOD stock has advanced alongside the recent performance of the U.S. equities market, with the Nasdaq 100 and S&P 500 reaching all-time highs. Higher stock prices lead to increased trading volume for brokerage companies like Robinhood and Schwab.
Robinhood shares have also benefited from its growing exposure to the crypto market, where it has become a major player. The company recently acquired Bitstamp, whose 24-hour volume jumped to nearly $200 million.
The most recent earnings results showed that Robinhood’s funded customer accounts rose to 25.8 million, up from 23.9 million during the same period last year. Gold subscribers increased to 3.19 million from 1.68 million in 2024.
Additional data revealed that total platform assets increased to $221 billion, while net deposits rose by $18 billion. This growth translated into quarterly revenue of $918 million, up from $618 million in Q1 2024.
Analysts anticipate that the company’s growth will continue. The average revenue estimate for the current quarter stands at $891 million, a 30% year-over-year increase. Annual revenue is expected to grow by 23% to $3.6 billion, followed by $4.24 billion next year.
Management hopes to accelerate this growth by rolling out its banking solutions, expanding internationally, and innovating through the launch of tokenized products.
The risk, however, is that the company appears significantly overvalued, with a price-to-earnings ratio of 56, well above the sector median of 10. The stock is also trading above the average analyst price estimate of $70.38.
Robinhood stock price analysis

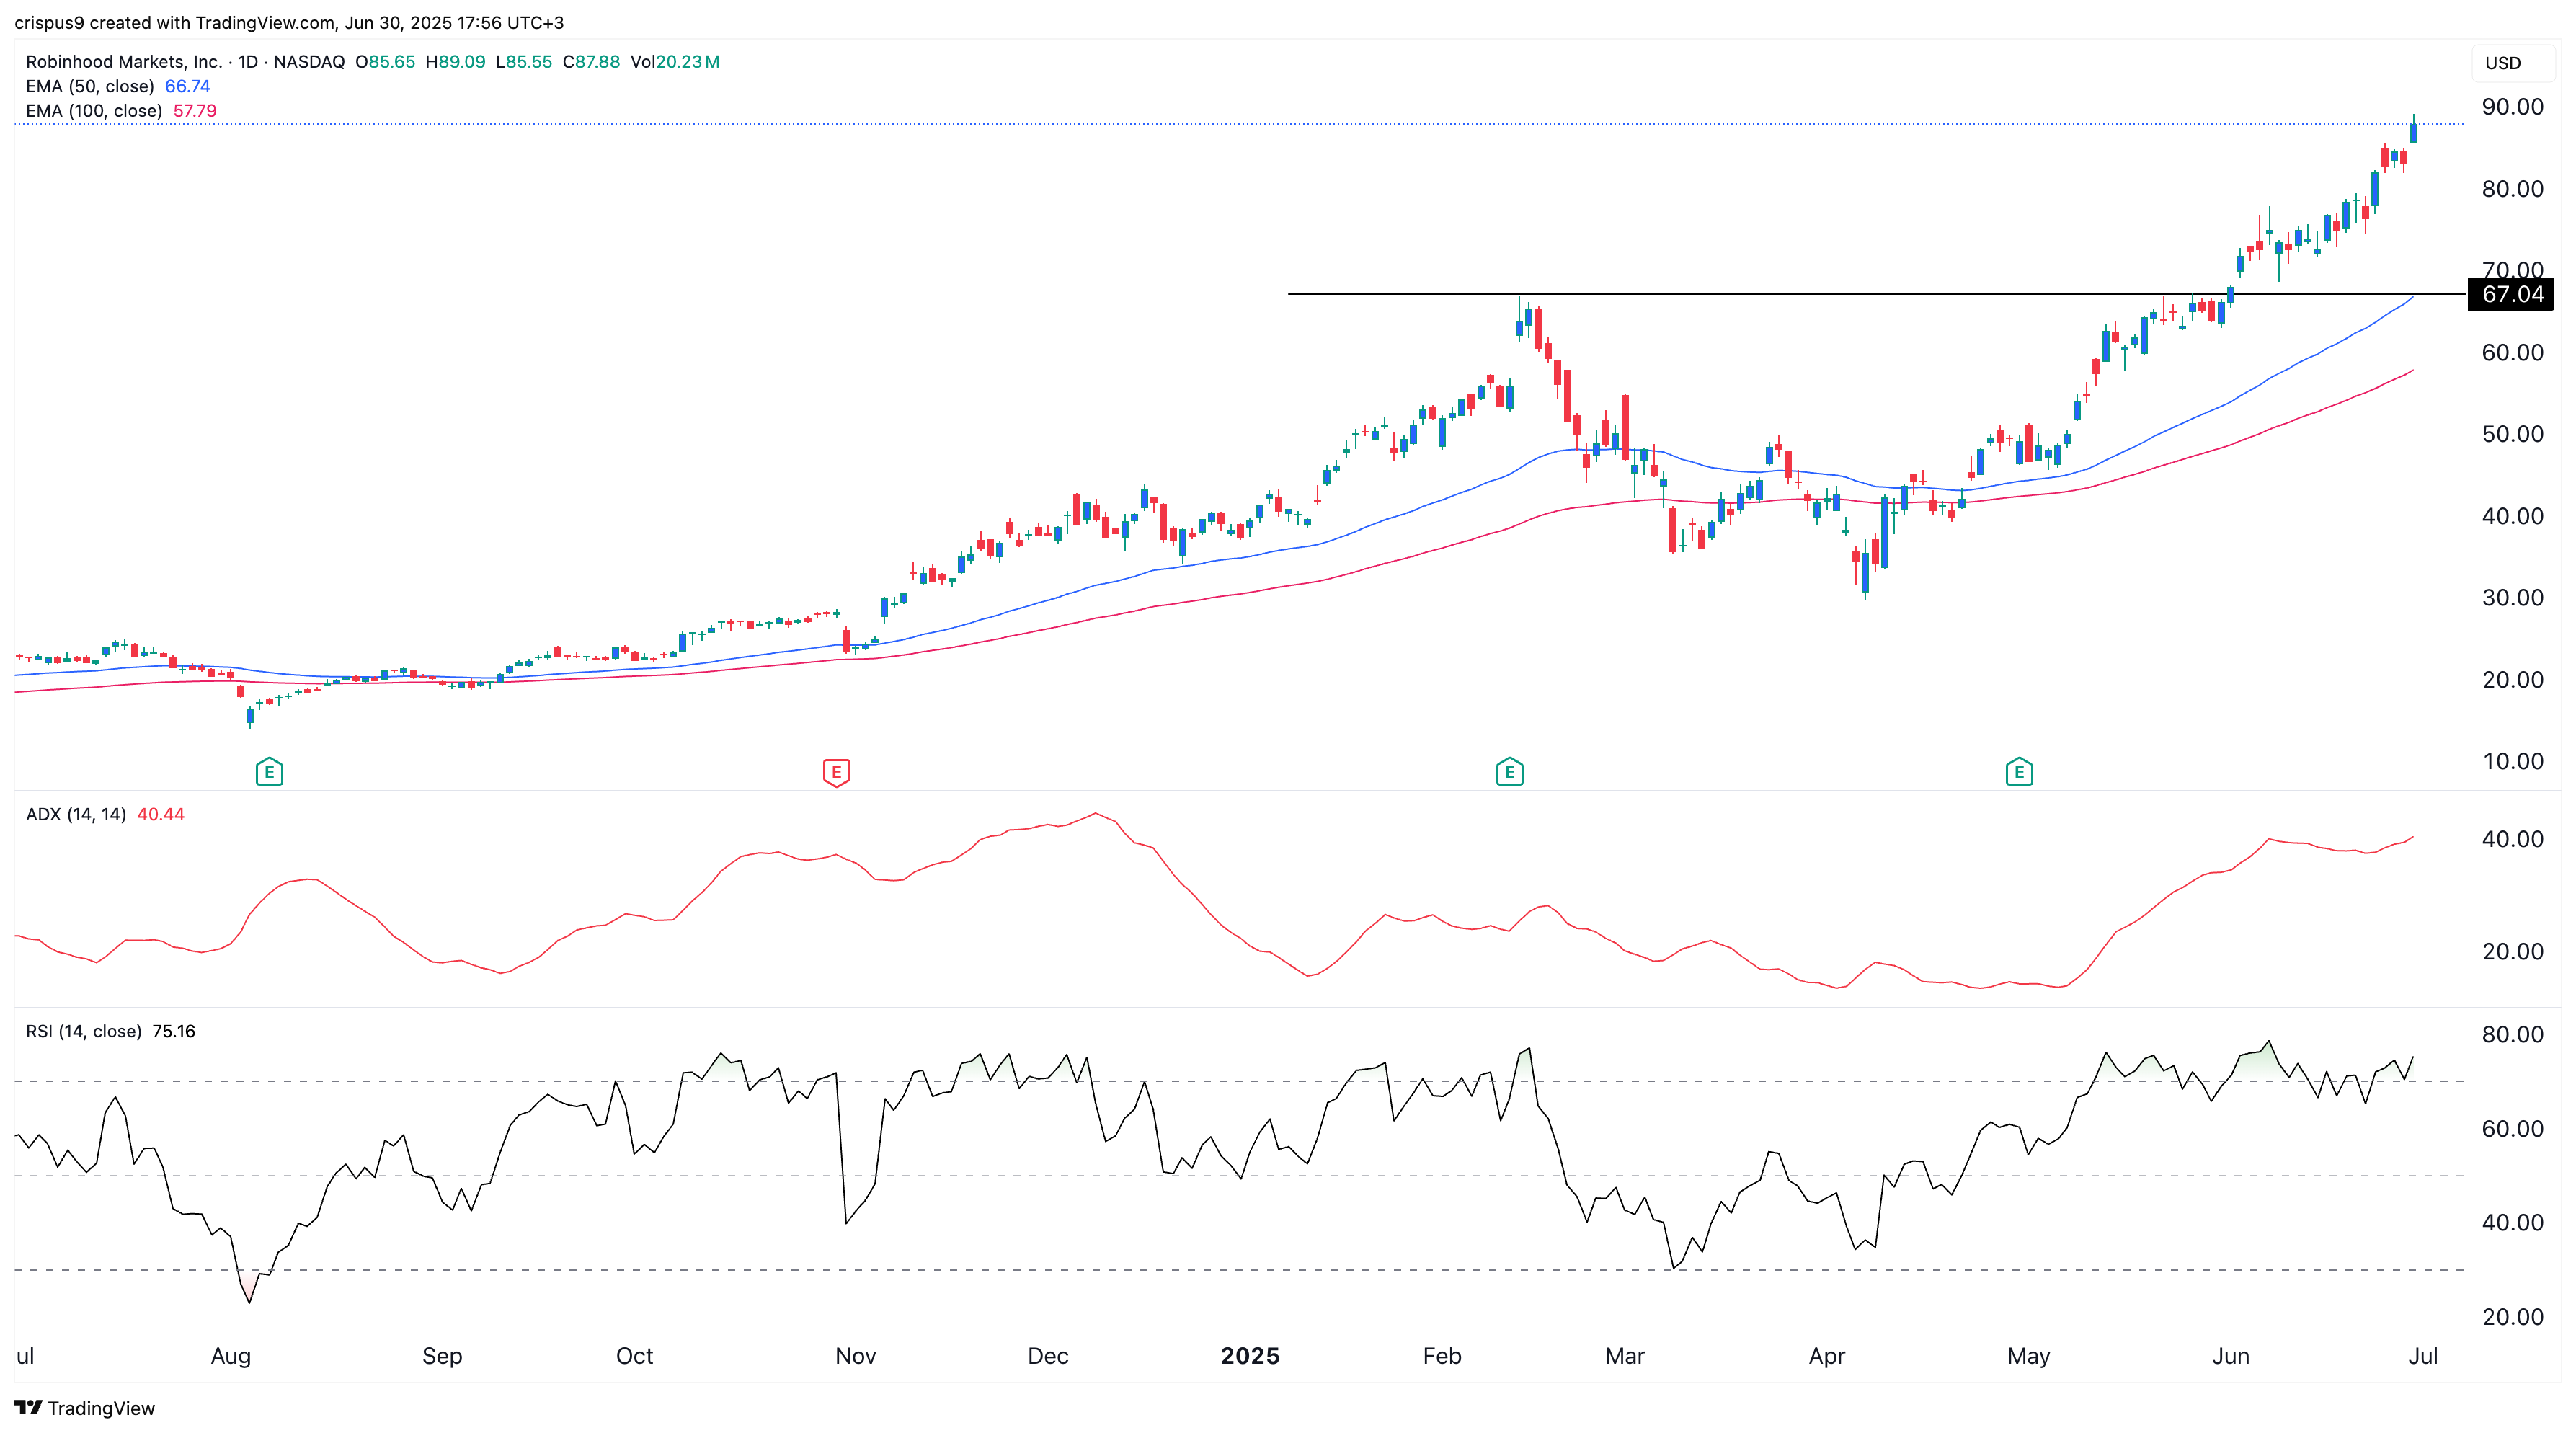
The daily chart shows that HOOD stock has been in a strong bull run and is now hovering near its all-time high. It has jumped above a key resistance level at $67, the highest swing from February.
The Relative Strength Index has climbed above the overbought threshold, while the Average Directional Index has reached 40, an indication that the bullish trend is strengthening.
The stock has remained above its 50-day and 100-day Exponential Moving Averages. Currently, it is trading approximately 32% above the 50-day EMA.
HOOD may undergo a mean reversion and potentially retest support at $67, which aligns with both the 50-day EMA and the previous February high.


