3 reasons why the Jasmy price may jump 165%


Jasmy Coin price continued its downward trend this week as the crypto fear and greed index fell to 35, reflecting increased market uncertainty.
The JasmyCoin (JASMY) retreated to $0.021, marking a 63% decline from its December high. This means it is now firmly in a bear market, where an asset drops by at least 20% from its recent peak.
The ongoing JasmyCoin sell-off has coincided with a broader market downturn, as traders remain fearful and many stay on the sidelines. Bitcoin (BTC), which heavily influences altcoin movements, has dropped from $109,200 to $96,000, further dampening sentiment.
The crypto fear and greed index, which stood at 88 in the extreme greed zone earlier this year, has now fallen to 35. Cryptocurrency prices often decline sharply when market sentiment shifts toward fear.
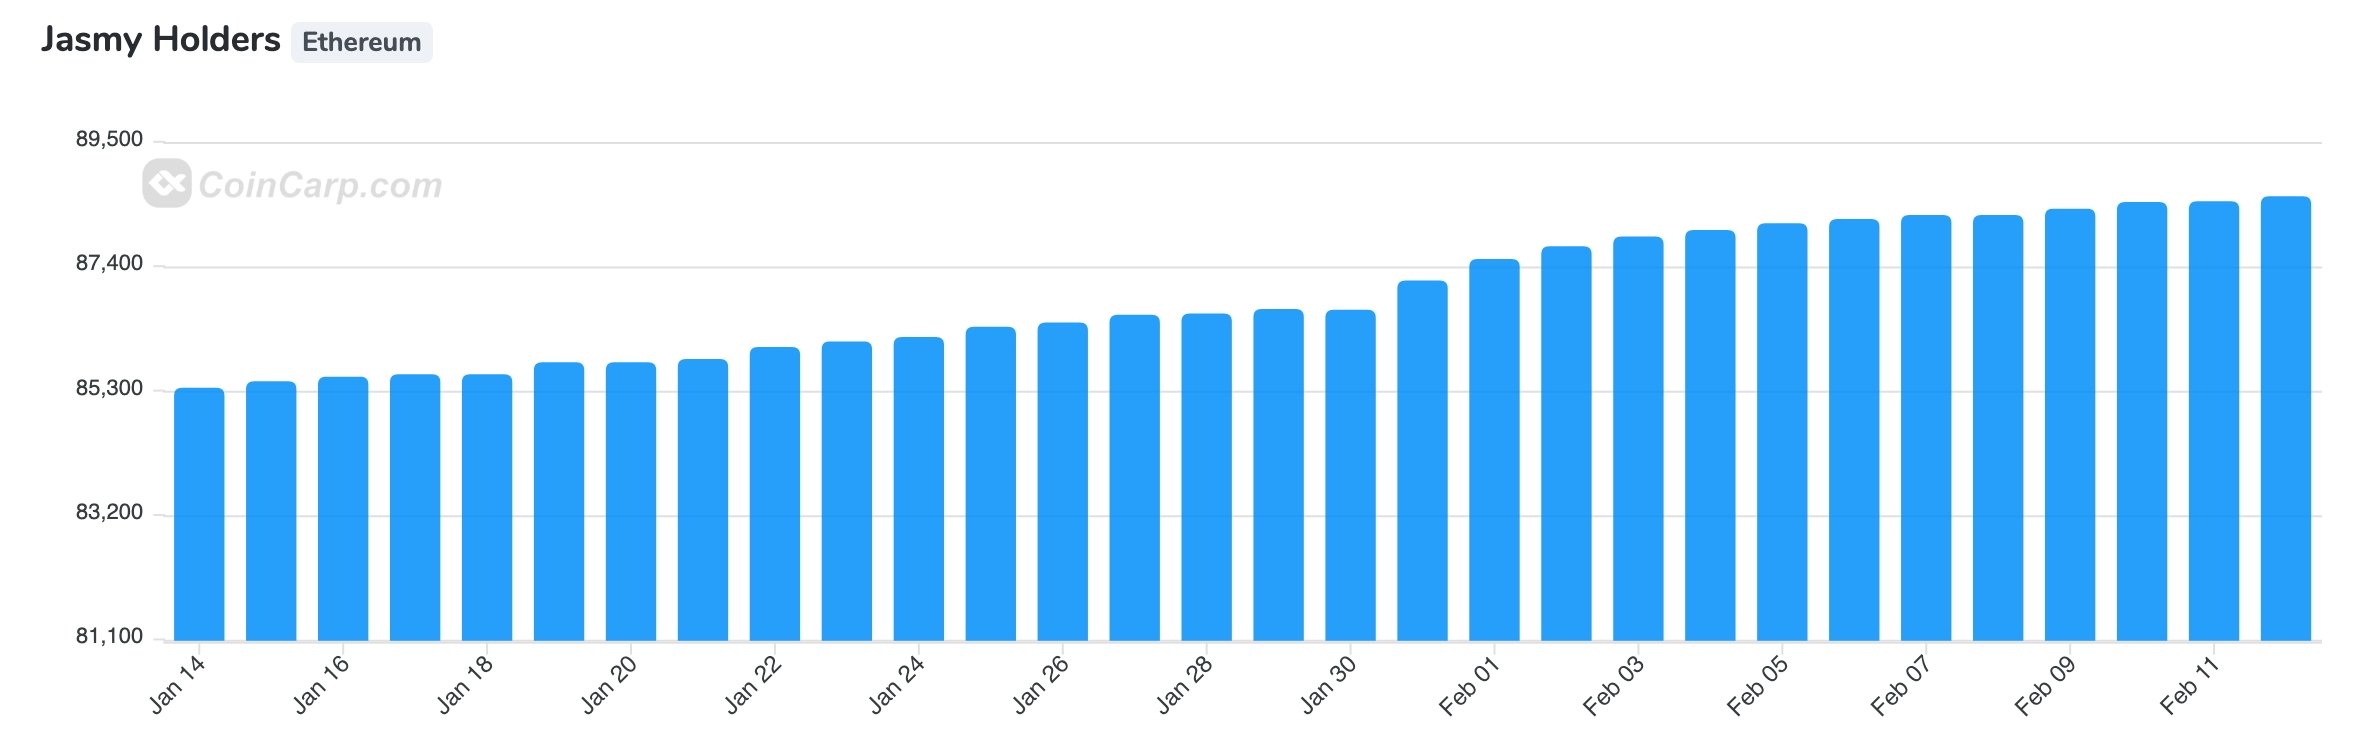
On the positive side, there are signs that Jasmy holders are not selling. According to CoinCarp, the number of JASMY holders rose to 88,600 on Feb. 12, up from 85,300 a month earlier. Typically, crypto traders sell off their holdings during sharp price declines, but this trend suggests otherwise.
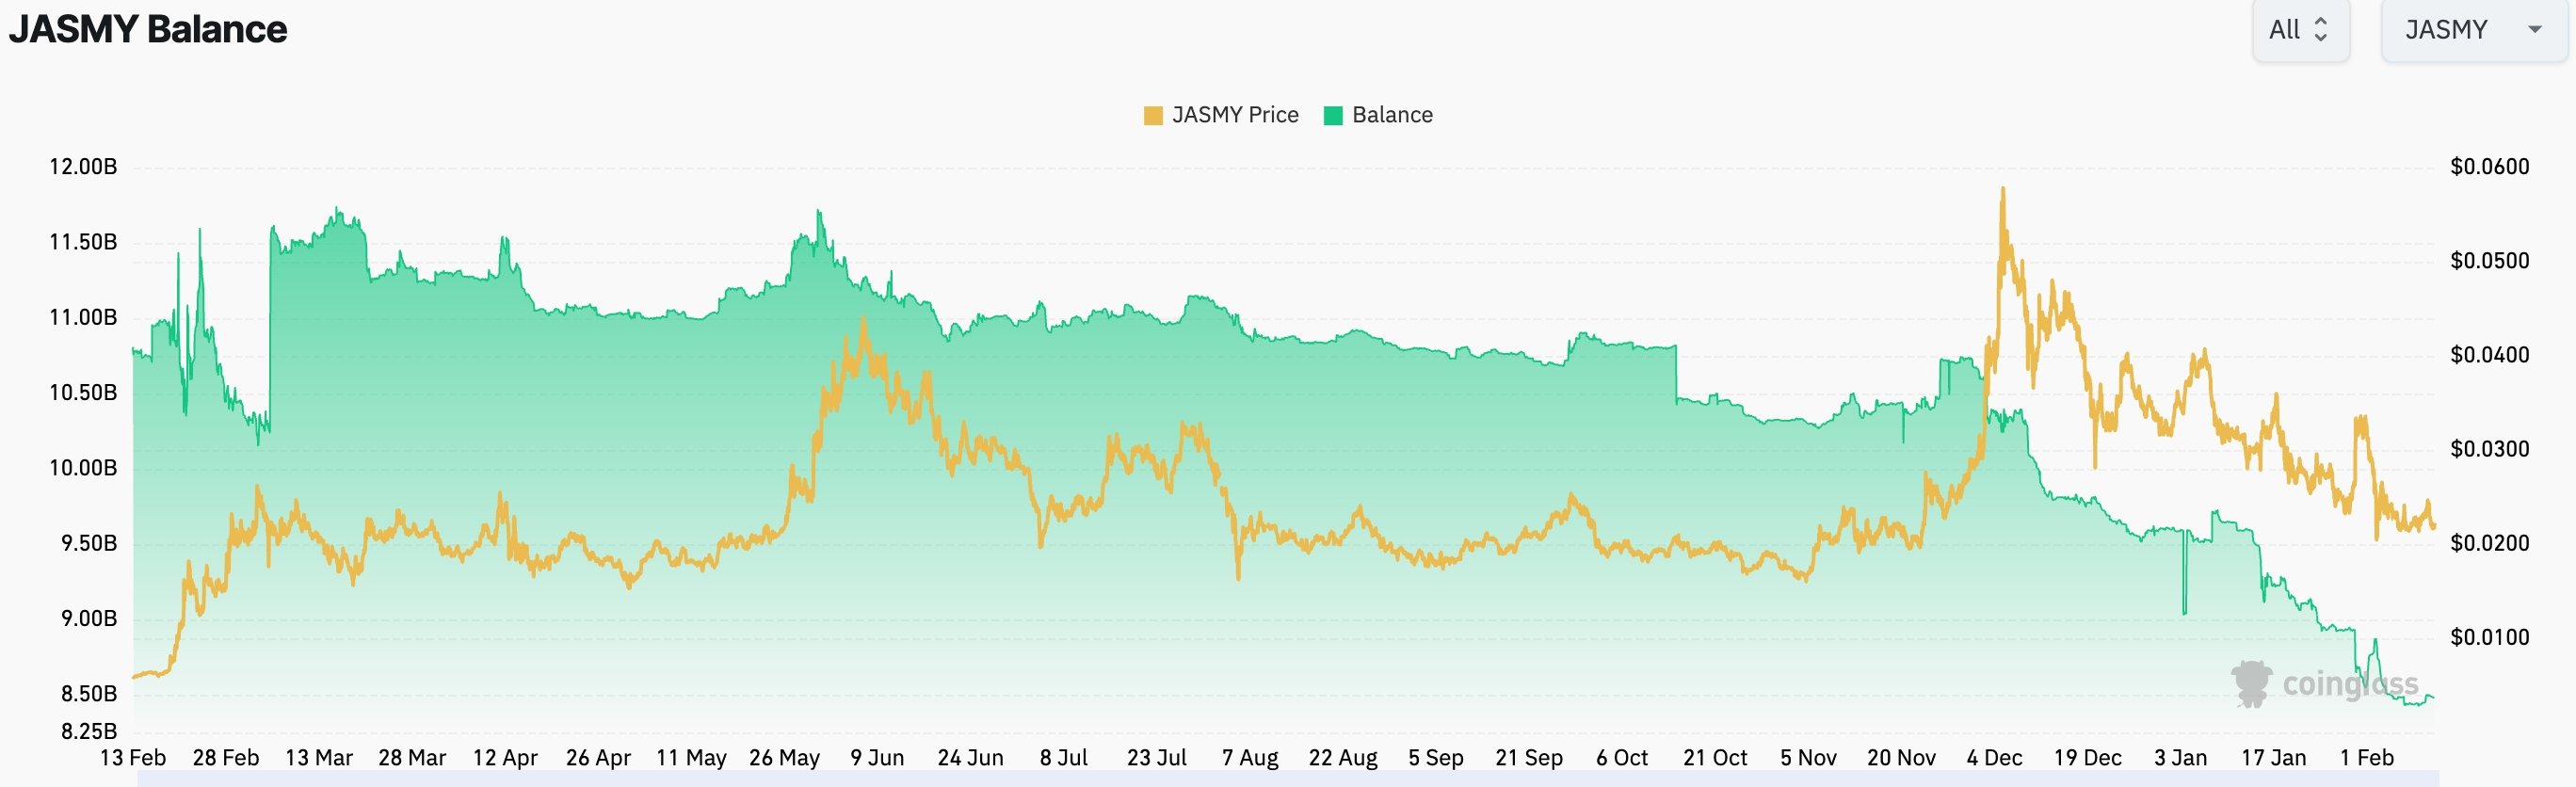
Another potential catalyst for Jasmy’s price is the continued decline in exchange balances. The total supply held on exchanges has fallen to 8.49 billion, down from 11.67 billion in March last year.
A drop in exchange balances is often a sign that holders are not moving their tokens to CEX platforms to sell. Instead, most investors are keeping them in self-custody wallets, hoping the coin will rebound.
Jasmy price analysis
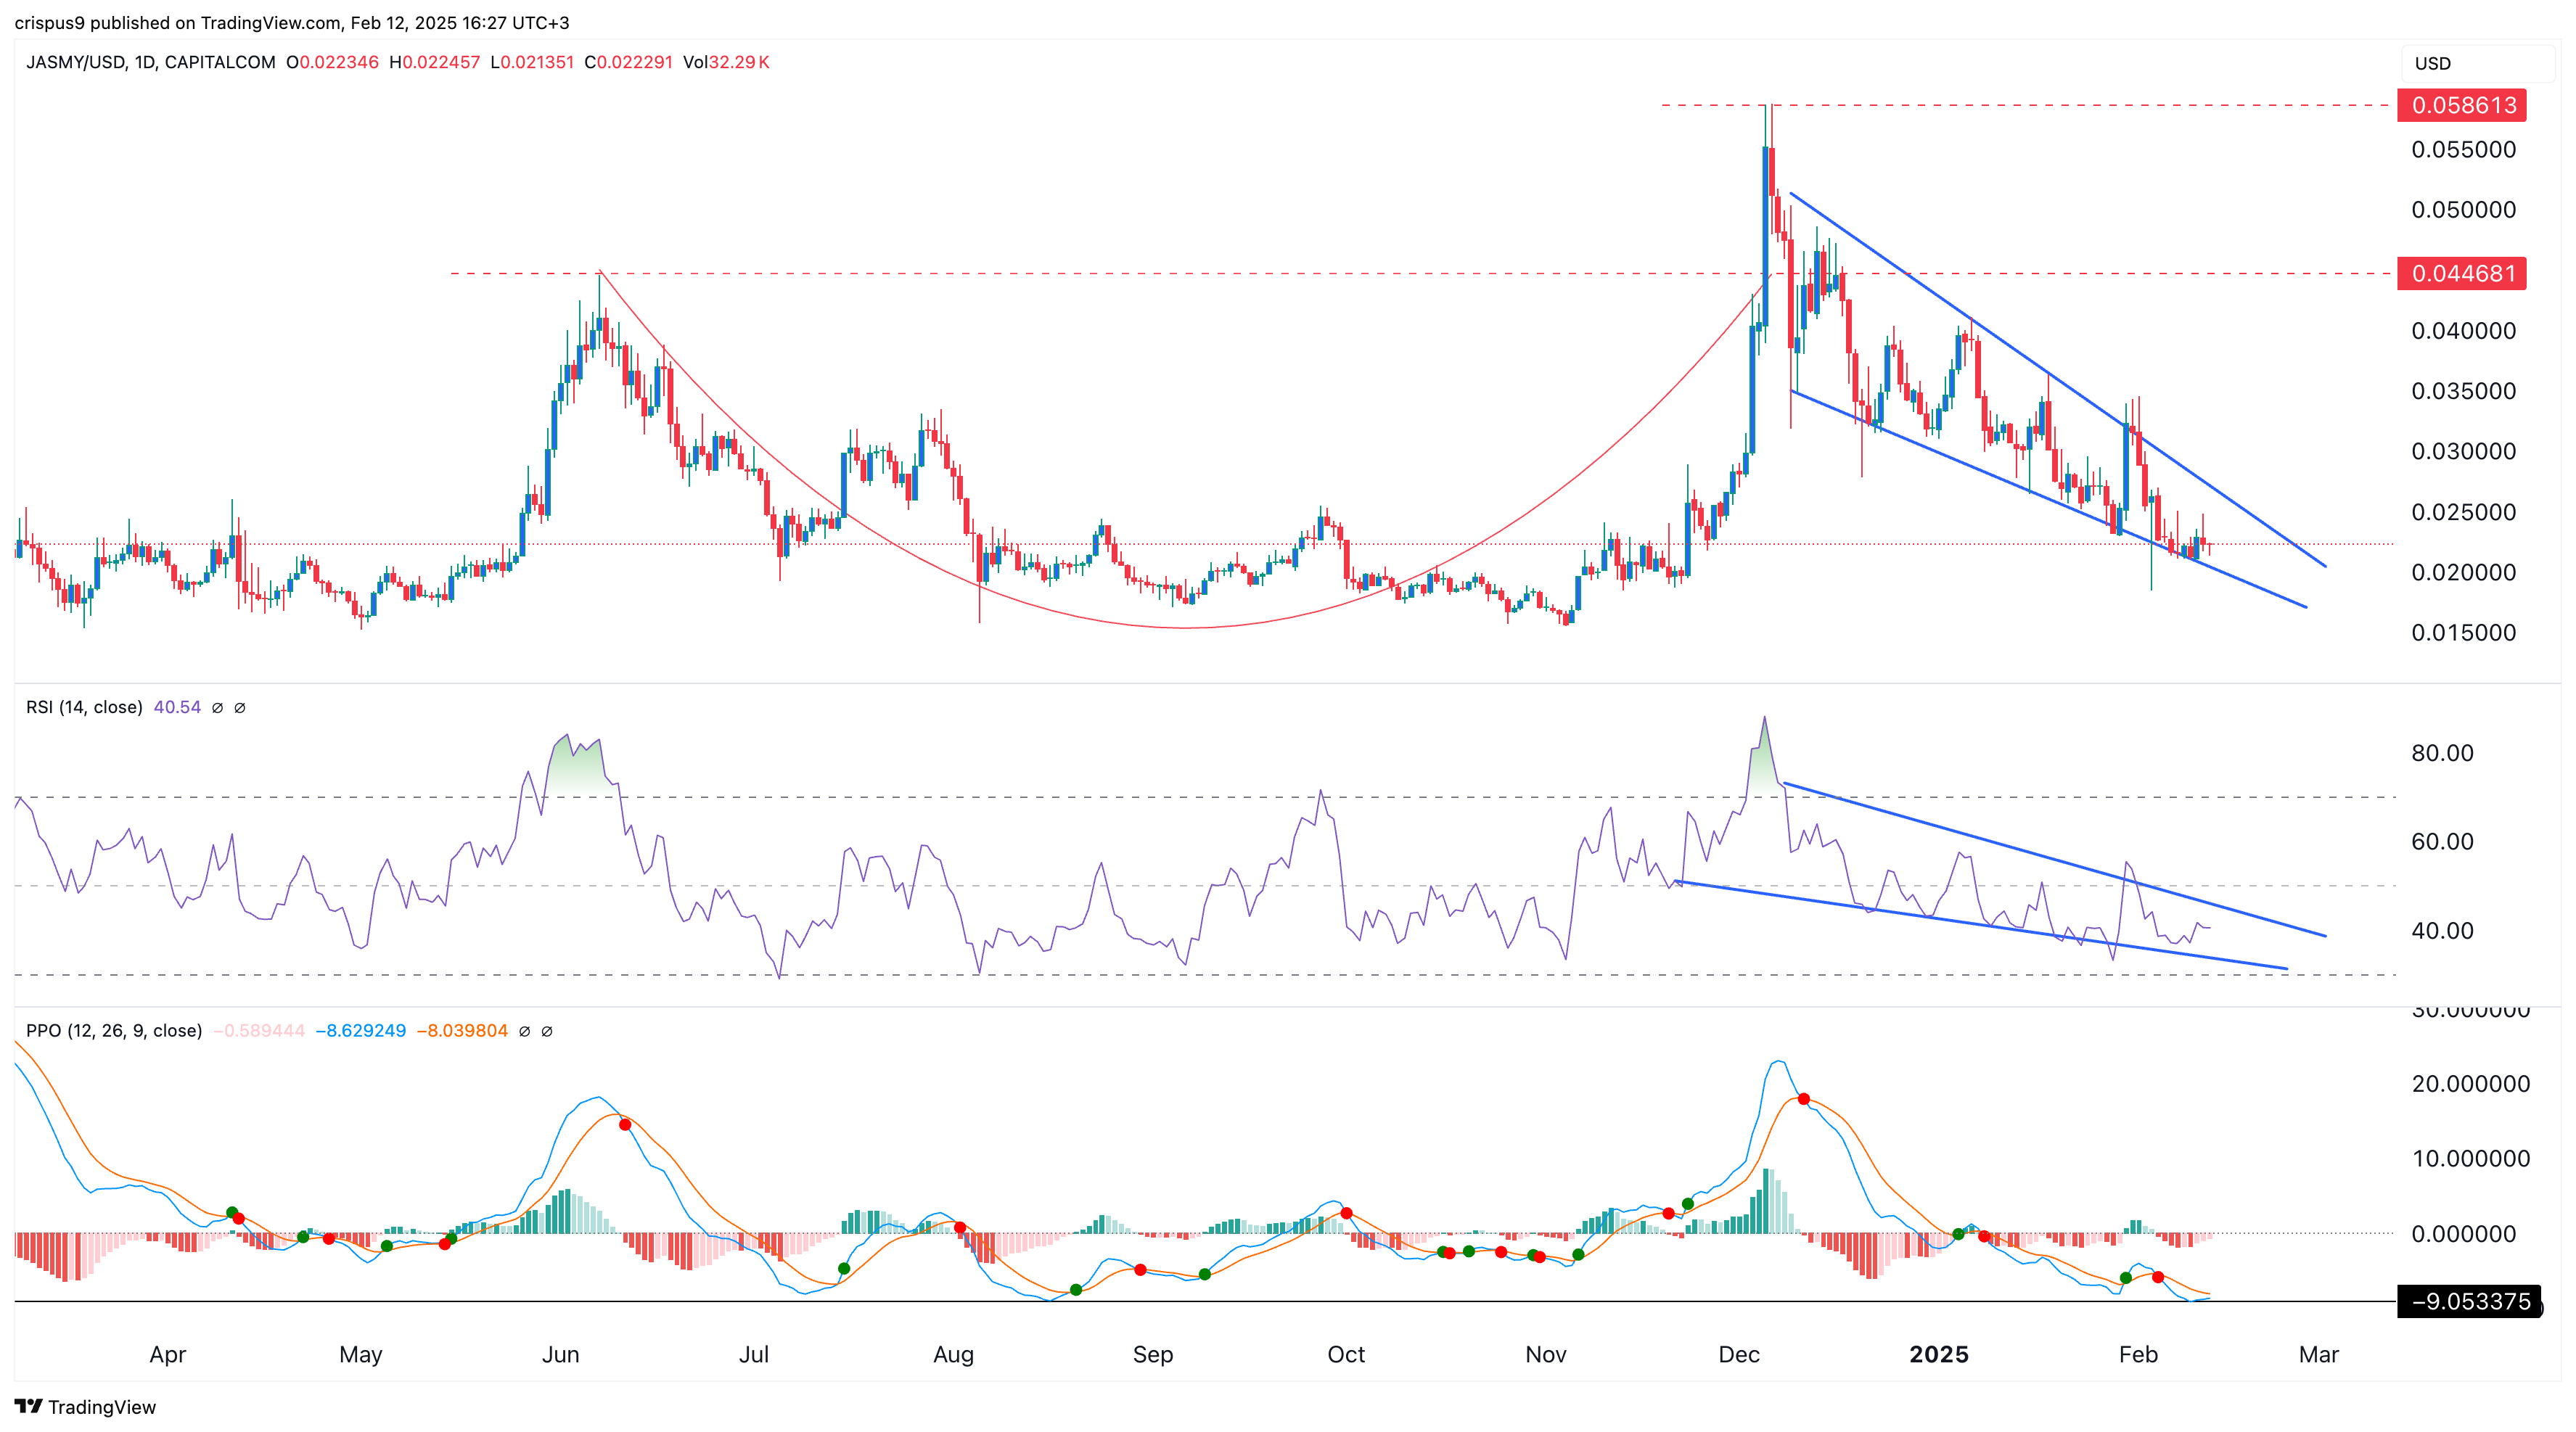
Another factor in JasmyCoin’s ongoing price decline is the formation of a falling wedge pattern. This pattern, characterized by two descending, converging trendlines, often signals a potential reversal. In this case, Jasmy’s trendlines are nearing their confluence point, suggesting that a rebound may happen soon.
The Relative Strength Index has also formed a falling wedge chart pattern. Meanwhile, the Percentage Price Oscillator has dropped to its lowest point since August 2024. Jasmy saw a strong rebound the last time it reached this level.