4 charts that explain the ongoing Ethereum price crash


Ethereum price has been on a freefall this year, making it one of the worst-performing major cryptocurrencies.
Ethereum (ETH) has dropped for three consecutive weeks, falling to its lowest level since March 2023. It has lost over half of its value from its November peak, costing investors billions. This article breaks down the ongoing Ethereum price crash using key charts.
Spot Ethereum ETFs have had substantial outflows
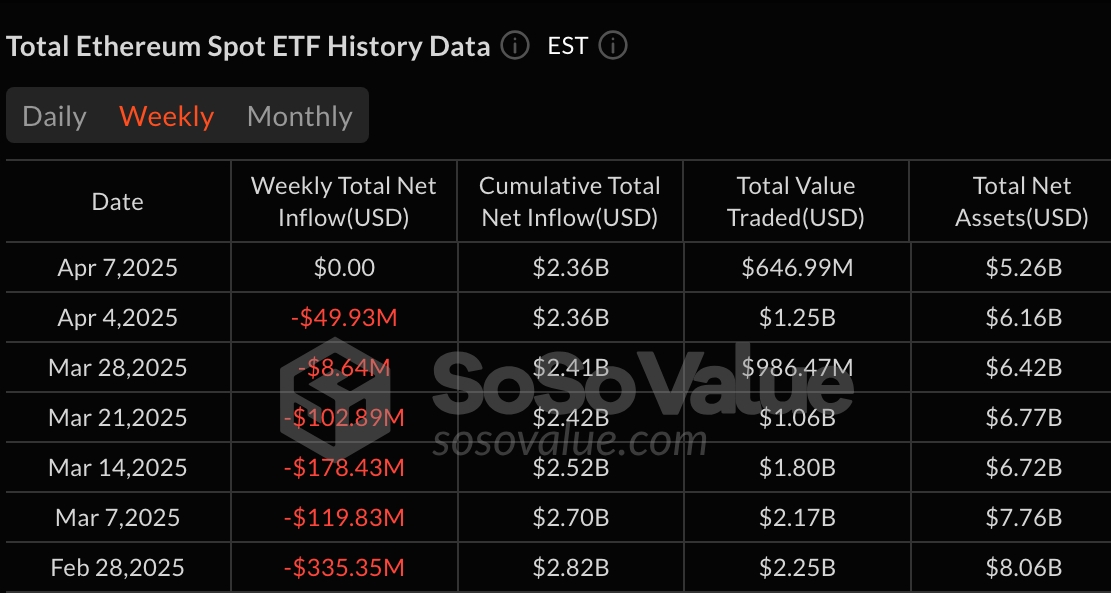
One reason why the ETH price has plunged is that spot ETFs have had substantial outflows this year, pointing to weak demand in the United States. The chart below shows that these funds have had net outflows in the last six consecutive weeks. These funds now have just $2.3 billion in net inflows compared to Bitcoin’s $35 billion. That is a sign that investors prefer Bitcoin to ETH by a wide margin.
Ethereum no longer leads in fees
For a long time, Ethereum was the most profitable chains in the crypto industry as it dominated industries like DeFi, gaming, non-fungible tokens, stablecoins, and Real world Asset tokenization. This performance has changed this year, and the network has been overtaken by other popular chains.
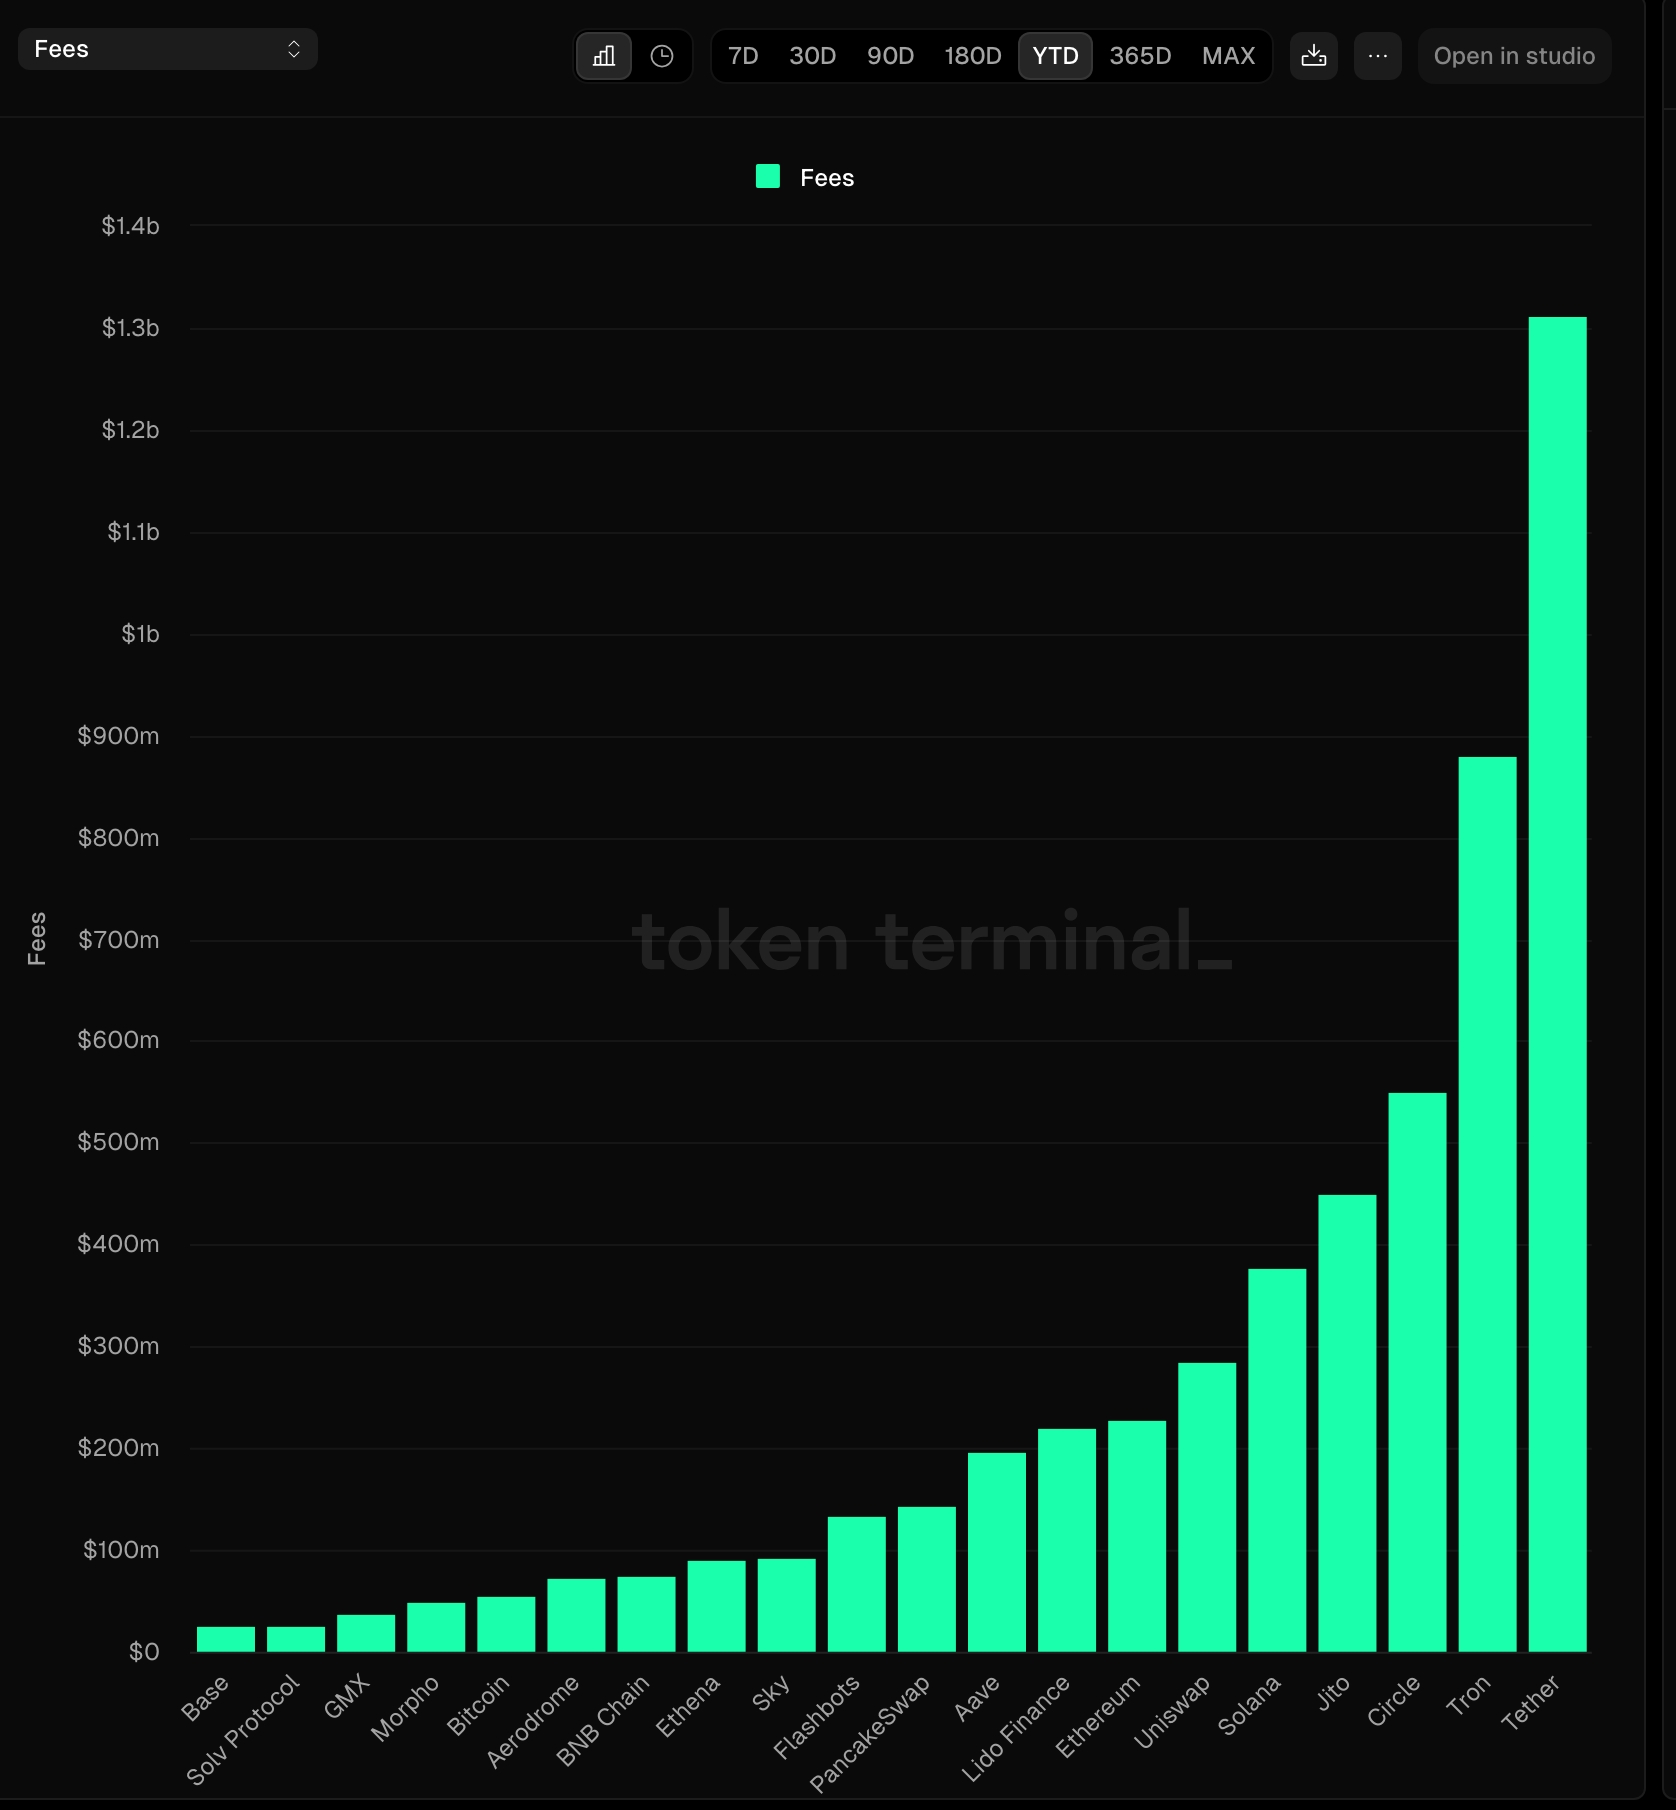
The chart below shows that Ethereum has generated $227 million in fees this year. In comparison, Tether has raked in $1.3 billion, Solana $376 million, and Tron $880 million, largely due to their stablecoin-related activity. Platforms like Jito and Uniswap have also surpassed Ethereum in total fees.
Development activity has dropped
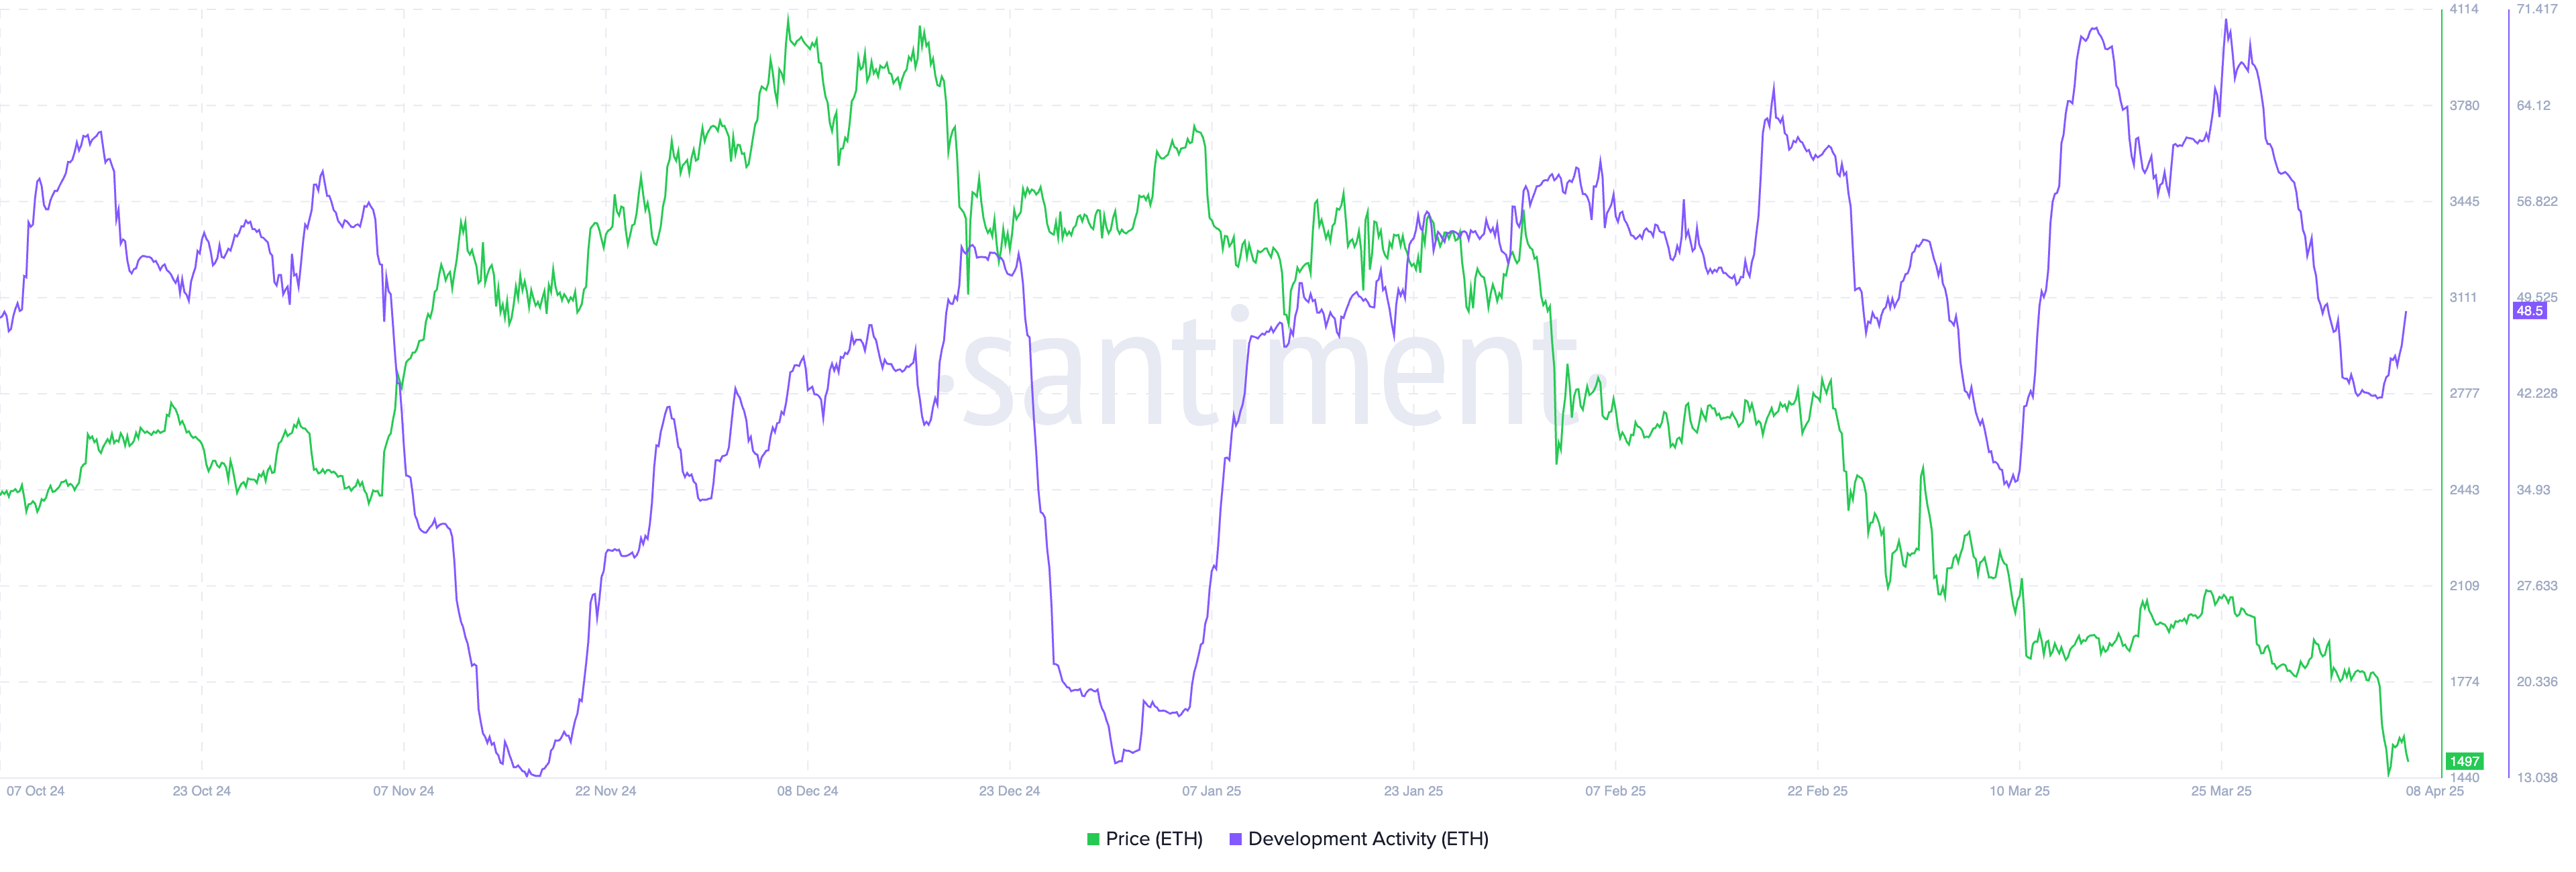
On-chain data also indicates that Ethereum’s developer activity has declined in recent months. This drop is likely due to developers migrating to other fast-growing chains such as Solana, Sonic, and Berachain. Many have also shifted focus to Ethereum’s layer-2 solutions like Base, Arbitrum, and Optimism, which offer faster speeds and lower transaction costs.
Ethereum price formed a triple-top pattern
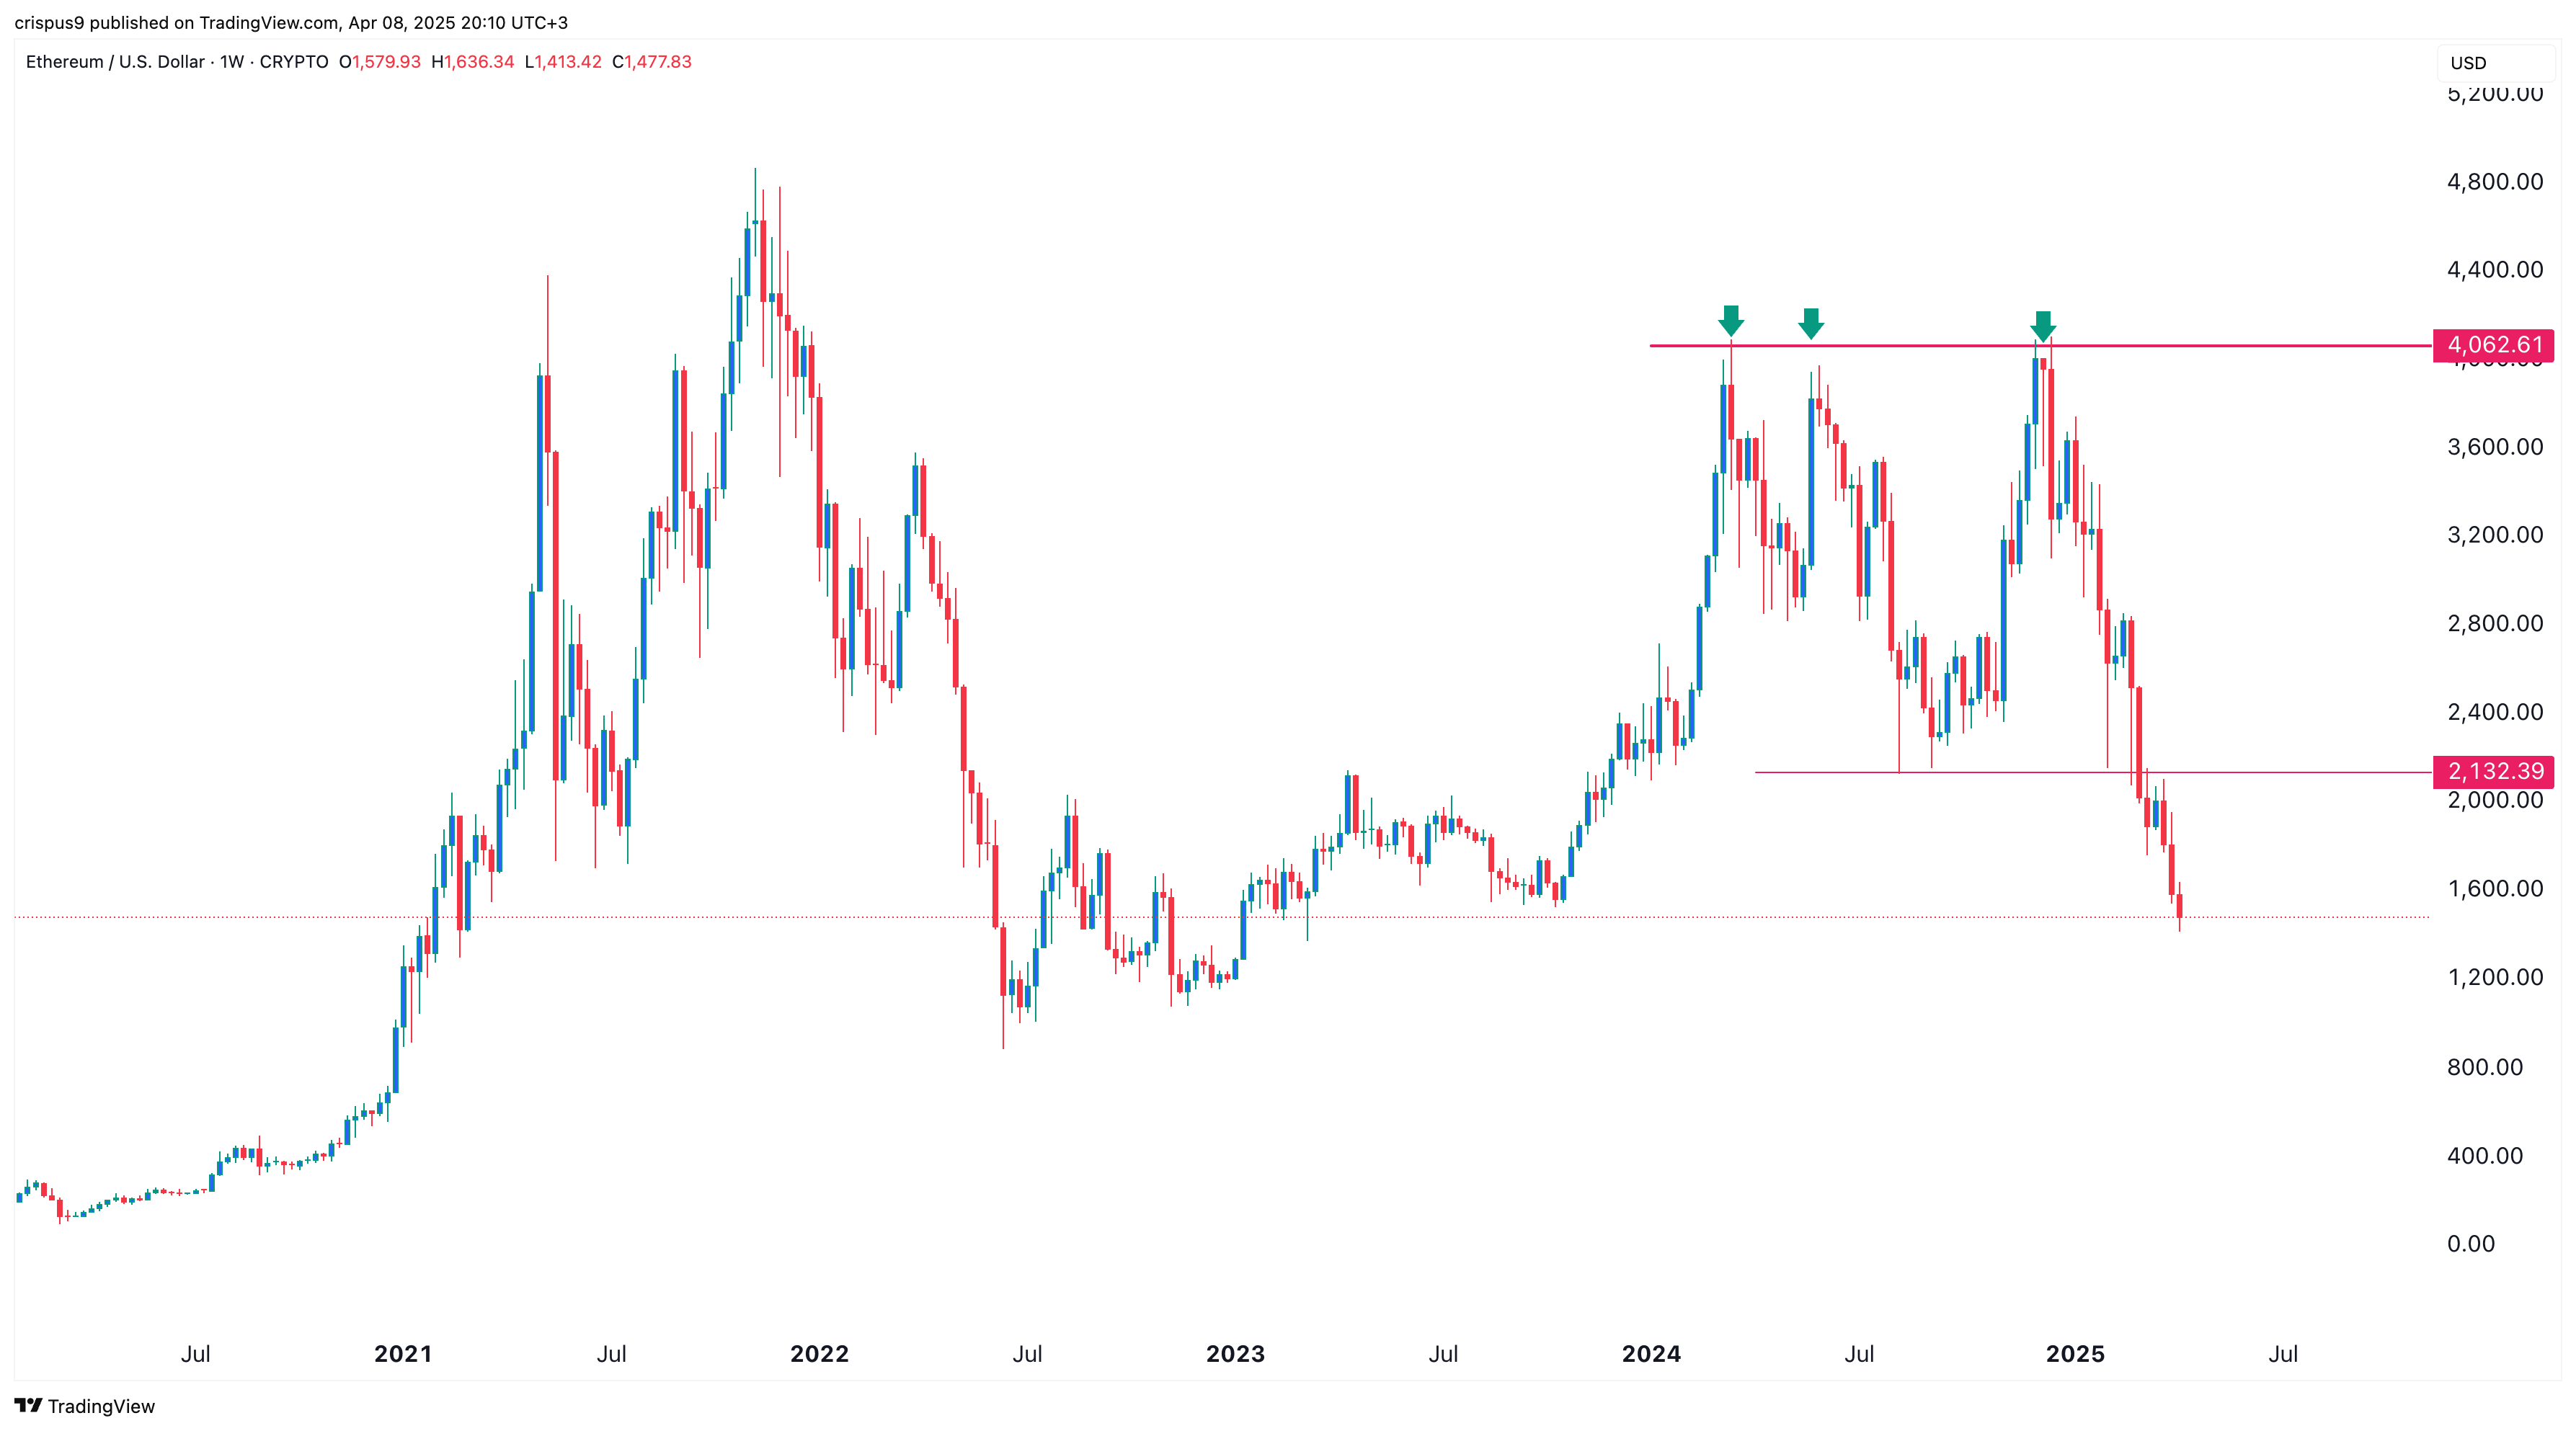
From a technical perspective, Ethereum has fallen sharply after forming a bearish triple-top pattern on the weekly chart. This formation consists of three peaks at around $4,062 and a neckline at $2,132 — a key support level last tested on August 5.
ETH has now broken below this neckline, confirming the bearish signal. It has also fallen beneath both the 50-week and 100-week moving averages. As a result, the next downside target could be $1,000.
Summary
Ethereum has experienced a sharp decline in 2025, turning a $10,000 investment in November into just $3,650. Weak fundamentals and negative technical indicators suggest that further downside may be likely in the coming months.