Bitcoin (BTC), Ethereum (ETH), Major Altcoins – Weekly Market Update October 17, 2022

The cryptocurrency market lost $10 billion from its market cap during the last seven days and now stands at $928 billion. The top 10 coins traded in red during the last seven days with Cardano (ADA) and XRP (XRP) being the worst performers with 12.5 and 11.8 percent of losses respectively. Bitcoin (BTC) is currently trading at $19,390 while Ethereum (ETH) is at 1,319.
BTC/USD
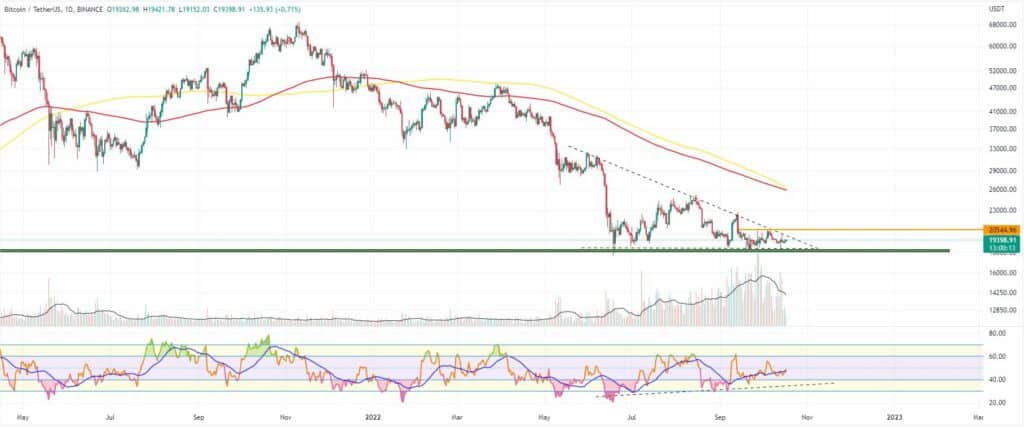
Bitcoin closed the trading day on Sunday, October 9 flat at $19,440. The coin has been trading in a downtrend since it hit the $20,460 mark and the mid-term diagonal resistance line on October 6. However, it still managed to end the previous seven-day period with a 2 percent increase.
On Monday, the BTC/USDT pair fell down to $19,140 and erased 1.5 percent of its market capitalization. It was slowly moving towards the major support area in the $18,000 – $18,500 range as traders were anxiously waiting for the next CPI inflation data announcement on October 13.
The Tuesday session was no different and BTC hit $18,886 early in the day before closing flat eventually.
The mid-week trading on Wednesday came with a short green candle to $19,140 as the price action was now extremely tight, moving in a Descending triangle pattern on the daily timeframe.
On Thursday, October 13 we saw a significant selloff prior to and after the US markets open due to the bad inflation data.
The price hit $18,300 and the major horizontal support, also breaking below the lower boundary of the Descending triangle, but bulls were quick to react and the partial recovery came in the evening.
The 24-hour trading volumes were still in a steady downtrend since the end of September.
Bulls pushed the price up to the high end of the triangle on Friday, but the rally was short-lived and not sustainable.
The weekend of October 15-16 started with a drop to $19,064 on Saturday in a relatively calm trading day.
On Sunday, the market started moving North, and BTC reached $19,267.
As of the time of writing this market update, the coin is continuing with its good performance, trading above $19,380.

ETH/USD
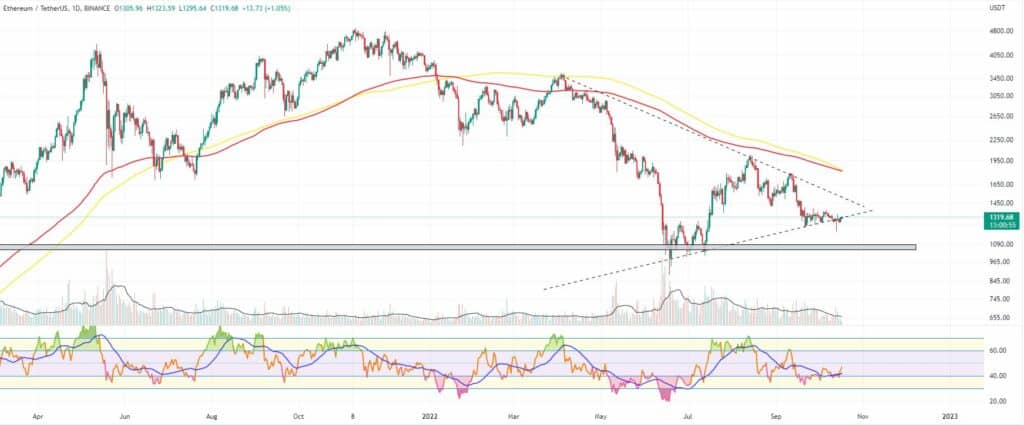
The Ethereum Project token ETH ended the previous week at $1,322 after forming a small green candle on the daily chart on Sunday, October 9 after 4 days of intense selling. The coin jumped back up from the long-term diagonal support line on the weekly timeframe chart.
The ether opened the new seven-day period with a 2.3 percent drop on Monday, hitting the lower boundary of the improvised bear flag pattern on the daily chart at $1,291. Just like was the case with BTC, the leading altcoin was now trading in an extremely small price range, building up for a big move – up or down.
On Tuesday, October 11 bears pushed the price further down to $1,271. Looking at the Relative Strength Indicator (RSI) we have been slowly re-entering the oversold area on both the 1D and 1W charts. Trading volumes continued to be in a stable downtrend.
The third day of the workweek came with a green candle to $1,294 as bulls were testing from below the mentioned lower end of the Bear Flag.
On Thursday, October 13 the ETH/USDT was extremely volatile before and after the major fundamental data announcement in the United States. A sudden flash crash resulted in an 8 percent drop to $1,191 during intraday all caused by the disappointing CPI. The coin, however, recovered quickly and ended the session with a relatively small loss.
The Friday session saw ether climbing as high as $1,343, but the momentum was not on the buyer’s side and they were not able to keep the gains, but only erased the losses from the previous trading day.
The first day of the weekend came with a 1.8 percent drop to $1,274. The ether could not break back above the mid-term diagonal support and suffered a rejection.
Then on Sunday, it formed an engulfing candle on the daily chart and climbed up to $1,310.
What we are seeing midday on Monday is another green session for the ETH/USDT pair.

Leading Majors
- Polygon (MATIC)
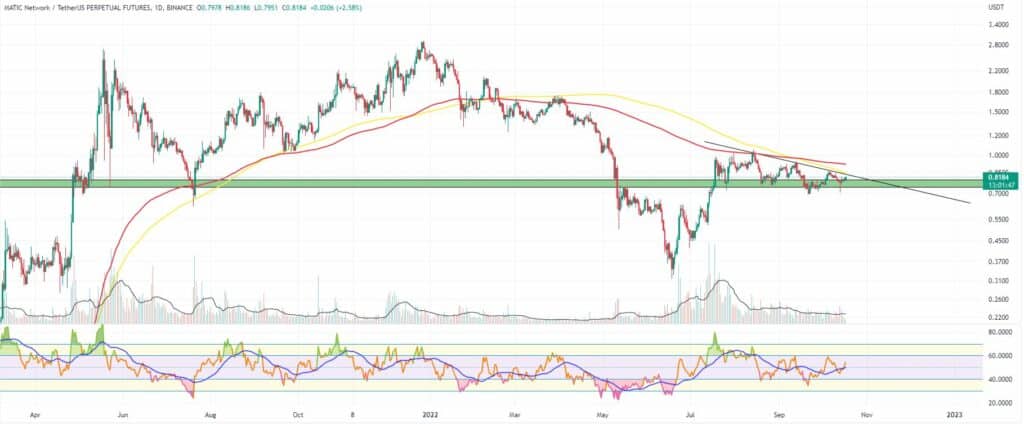
The popular Layer 2 network and Ethereum competitor is not shining but still manages to keep its price floating above the major support levels.
The MATIC/USDT pair has been trading in the $0.75-$0.80 area since the end of July when it first tested it from above, but the psychological level of $1 remains an unbreakable resistance for buyers.
The series of new developments announced by the Polygon team including the Polygon zkEVM or zero-knowledge EVM has been keeping investors alerted and on standby about what the price can offer in the near future.
What we can expect from the MATIC token is to gradually move in the upward direction if the market remains neutral or slightly bullish. The first major zone of interest for bulls will be $0.87, followed by $1. Down, we see support in the $0.7-$0.73 range.

Altcoin of the week
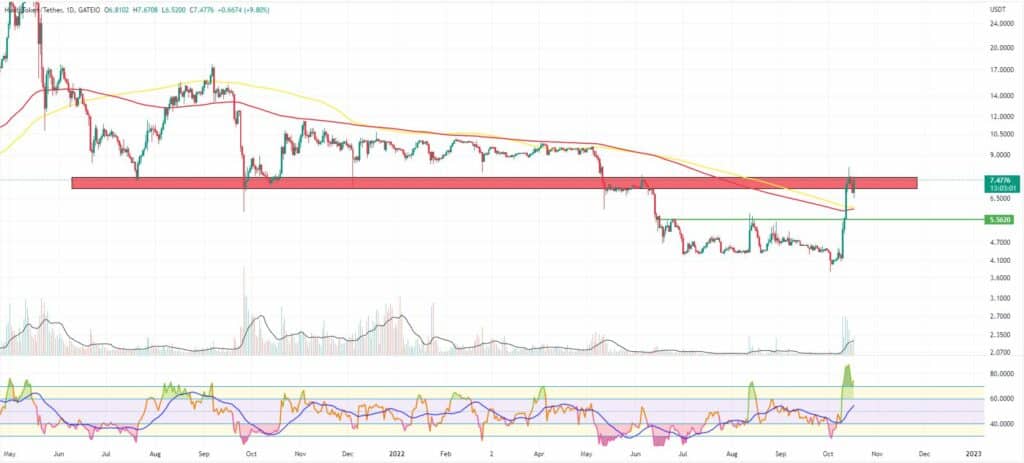
Our Altcoin of the week is Huobi (HT). The native token of the Huobi exchange was the best-performing asset during the last seven days. The coin added 64 percent to its valuation hitting a weekly high of $8.25 for the first time since the beginning of May this year.
The Huobi token is currently trading 89 percent above its September lows, but struggling to surpass the major horizontal resistance in the $7 area on both the daily and weekly timeframes.
The main reason behind the rapid growth of HT is the recent announcement by Justin Sun, founder of the Tron cryptocurrency and ecosystem about his membership on Huobi’s global advisory board and his supposed involvement in the project. Earlier this month Huobi agreed to be purchased by the Hong Kong investment company About Capital Management’s M&A fund.
The HT/USDT pair will be looking to break above the mentioned resistance while relying on support in the $5-$5.5 zone.


