Bitcoin
Bitcoin (BTC)
$63,815.00 0.94868
Bitcoin price
Ethereum
Ethereum (ETH)
$3,143.87 1.03756
Ethereum price
BNB
BNB (BNB)
$588.20 0.49801
BNB price
Solana
Solana (SOL)
$146.14 0.68568
Solana price
XRP
XRP (XRP)
$0.5309010 0.18447
XRP price
Shiba Inu
Shiba Inu (SHIB)
$0.0000249 0.1519
Shiba Inu price
Pepe
Pepe (PEPE)
$0.0000087 -0.09311
Pepe price
Bonk
Bonk (BONK)
$0.0000274 -4.46247
Bonk price
SirWin
SirWin
SirWin

Chainlink’s chart shows the first RSI bullish divergence ever

News
<strong>Chainlink’s chart shows the first RSI bullish divergence ever</strong>

Chainlink — the biggest on-chain data (oracle) protocol — is seeing its LINK token shine a bright green light according to this technical indicator.

Chainlink chart analysis shows that the weekly RSI is trending upwards in a bullish divergence while the price continues trading lower — a sign never seen before on the weekly chart for this token. The current weekly RSI of 43.33 suggests that the coin is picking up upwards momentum.
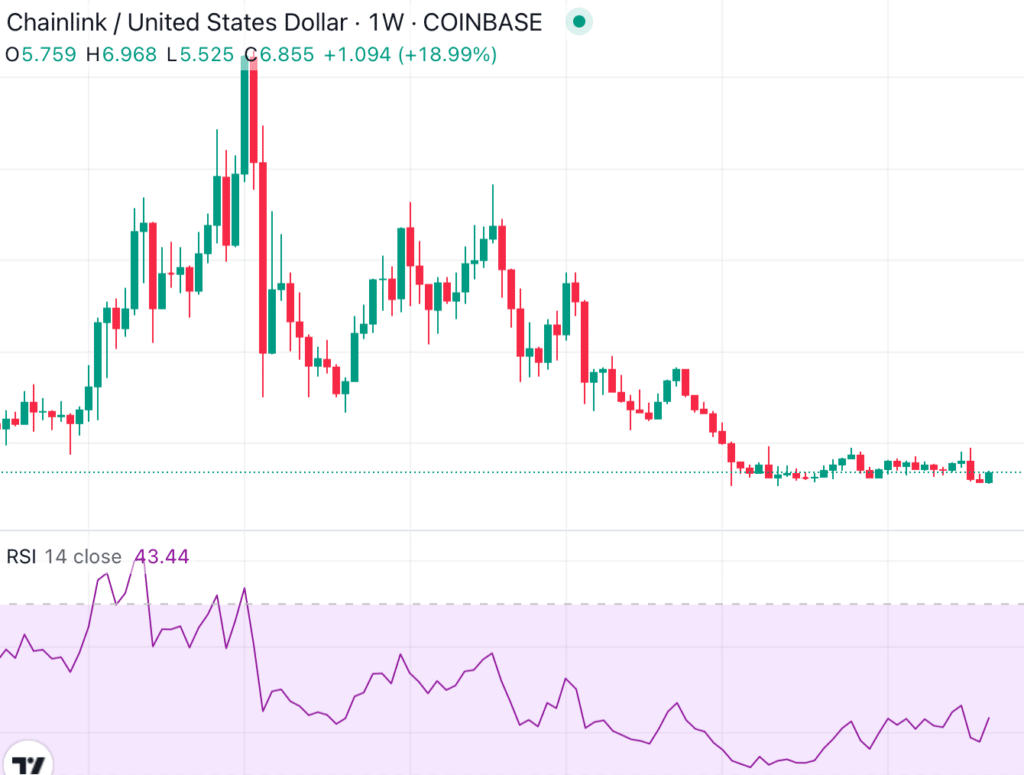
Chainlink's chart shows the first RSI bullish divergence ever - 1" class="wp-image-14097013">

According to Investopedia, “a bullish divergence occurs when the RSI displays an oversold reading followed by a higher low that appears with lower lows in the price.” The trading education website is quite clear as to the meaning of such an indication:

“This may indicate rising bullish momentum, and a break above oversold territory could be used to trigger a new long position.”

As of press time, Chainlink is trading at $6.84 after seeing a price increase of nearly 7% over the last 24 hours. The bullish momentum may propel LINK’s ascension towards the resistance located in the $9 area.