Aave whales on a selloff spree: can the altcoin survive the dump?

Aave is currently sailing turbulent waters as large whales appear to be selling off their holdings amid a period of downward pressure.
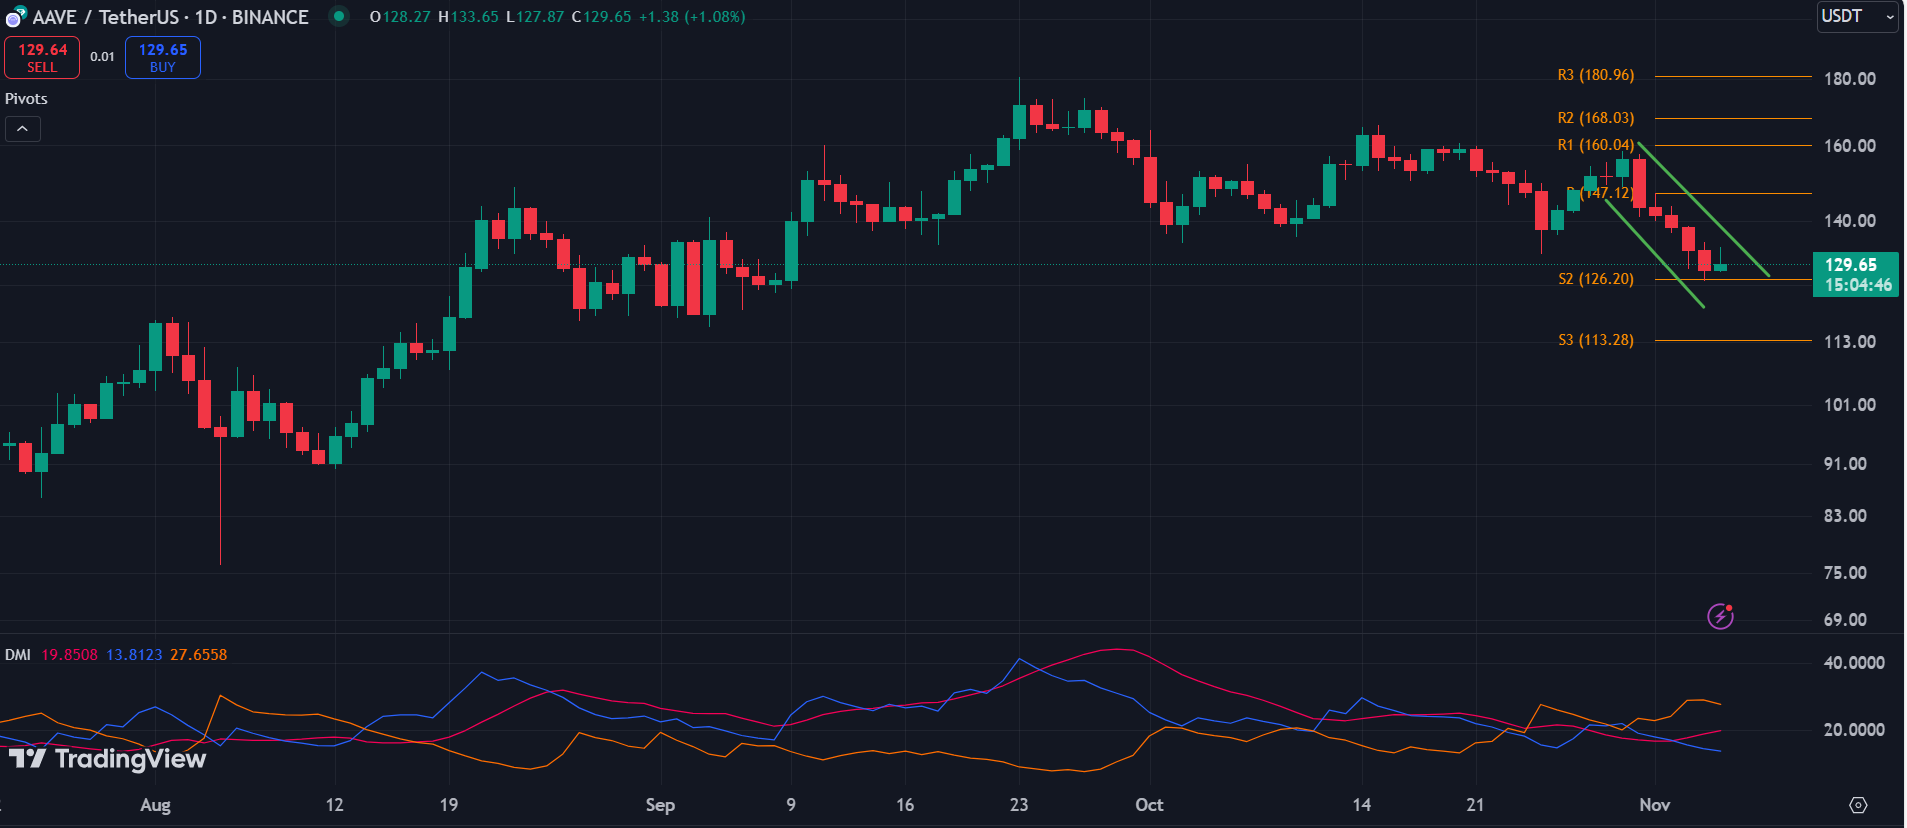
Over the past five days, Aave (AAVE) has faced a persistent decline, marking five consecutive red candles on the daily chart since Oct. 31.
After hitting a local high of $158 at the end of October, Aave’s price began a downtrend, falling around 14% over the following days to its current level near $129. Despite showing a slight recovery today, Aave is struggling to reclaim bullish momentum amid broader market volatility.
The broader market is showing some signs of recovery amid election-related events in the U.S., and Aave’s modest 1.1% increase today reflects this general uptick. However, without a decisive move above key resistance levels, Aave remains vulnerable to further declines.
One factor contributing to Aave’s decline is a series of large selloffs by major market players. Data from Lookonchain shows substantial recent transfers to exchanges by whales.
According to data from Lookonchain, wallet address 0x7634 withdrew nearly $3.39 million worth of AAVE and moved it to the MEXC exchange, signaling a potential sell-off.
Other major transactions include a $1.04 million transfer to Binance, a $1.29 million deposit to OKX, and another $1.02 million transaction to Binance—all within the past 24 hours. These large transactions indicate that whales are reducing their Aave positions, contributing to downward pressure on the asset’s price.
Can AAVE survive the whale dump?
Aave is up 0.66% over the past 24 hours, currently trading at $129.65 at the time of writing. The asset is down 15.74% in the last seven days, with its market cap slumping to $1.94 billion.

On the daily chart, the DMI confirms the bearish trend. The -DI stands at 27.6, indicating strong selling momentum, while the +DI is low at 13.8, highlighting weak buying pressure.
However, the ADX is at 19.8, signifying a lack of strong trend strength, which could imply a prolonged period of price consolidation. With the ADX dropping below 20, the bulls could leverage this opportunity to weaken the selling pressure.
The chart further shows pivot levels, with the current price sitting just above the support level at $126.2. If the price dips below this, Aave could face a further drop, potentially breaking below the $120 mark.
Meanwhile, the asset needs to gain significant ground to change the prevailing sentiment. Aave would have to surpass the pivot level at $147.12, a 13.5% increase from its current price, to shift momentum from bearish to bullish. Even then, additional resistance levels lie ahead at $160.04, $168.03, and $180.96.


