Analysis: BTC-USD Finding Strong Support at $430

After re-testing support at $42,2 momentum has recently shifted in the bullsè favor and is currently trading higher today by 0.82 percent on the BitStamp exchange. The price action has been very volatile today with psychological support around $430 holding strong. The market has recently closed below the base (dark-red) line which provides a weak bearish signal. However, the market looks to be moving back above the base line which is currently acting as minor resistance at $434.55; a close above this level in the next hourly session close will provide a strong bullish signal and see the market target the most recent fractal resistance at $439.67 indicated on the chart below.
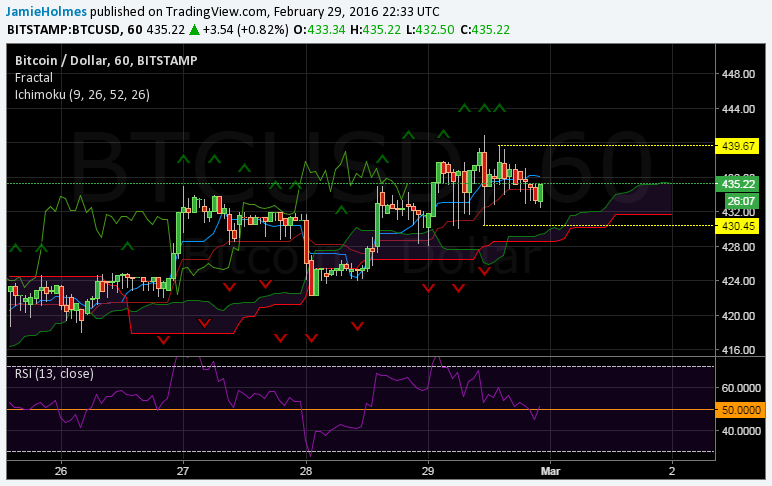
A close above the conversion line will provide further bullish confirmation which is currently acting as minor resistance at $436.08. The fractal resistance at $439.67 will serve as the next target for buyers and a close above this level will open up the $450 psychological level. A bearish outlook is only validated in the short-term if the market fails to close above the base line. Moreover, this will be further confirmed if there is a close below the most recent fractal support at $430.45.
The relative strength index is looking to move above 50 but has been in a downtrend for most of Monday’s sessions. Bullish momentum will be indicated with a move above 50 whereas selling pressure will likely dominate if the index moves below 50.
The chart below shows the long-term outlook illustrated by the chart below with the daily price action on the BitStamp exchange. After a bullish hammer candlestick pattern formed on Wednesday last week, the price has continued higher and has recently closed above the conversion line providing a strong bullish signal. The conversion line is now providing minor support at $428.53 and the market is moving to recent fractal resistance at $447.99. A break of this level will open up $500. A bearish outlook over the long-term is only validated if there is a daily close below the conversion line; this would see a test of the support at the base line currently at $407.97.
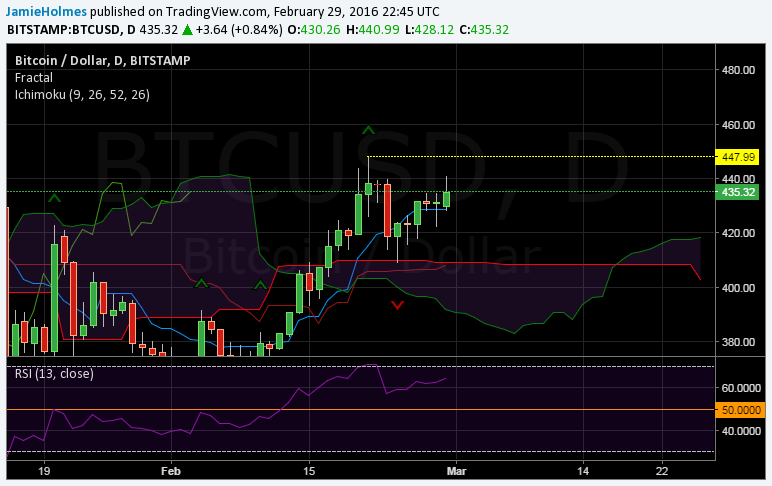
The relative strength index is trending upwards at the daily timeframe, indicating strengthening bullish momentum. However, buyers should be wary when the index passes above 70 and enters the overbought region.The Ichimoku cloud is starting to fan out and if it starts trending upwards then this will give further bullish confirmation. Moreover, the lagging line is still bound within the Ichimoku cloud 26 periods behind, and when the lagging line moves above the cloud this will provide another bullish signal. In short, we should see BTC-USD make an attempt at $450-$465 region before moving onto the psychological $500 level.