Aster token price forms bullish Double Bottom at $1.20, could this spark a rally?


Aster token price has confirmed a potential double bottom at the $1.20 region, suggesting that a bullish reversal could be underway if price breaks through key resistance levels.
- Aster forms a double bottom at $1.20 aligned with 0.618 Fibonacci support.
- A break above $1.83 would confirm bullish continuation.
- Sustained volume inflow is key to validating the reversal setup.
Aster (ASTR) token price is showing early signs of structural recovery, as the asset has retested its $1.20 support level twice with bullish reactions. Price has formed what appears to be a textbook double-bottom pattern.
This level was previously identified as important structurally, supported by technical confluence around the 0.618 Fibonacci retracement, and it highlights a potential accumulation zone that could serve as the foundation for a rally back toward the $1.83 resistance.
Aster token price key technical points
- Major Support: $1.20, confirmed by a double bottom and 0.618 Fibonacci retracement.
- Major Resistance: $1.83, aligned with the value area line and previous rejection zone.
- Market Structure: Bullish double bottom formation signaling a potential reversal setup.
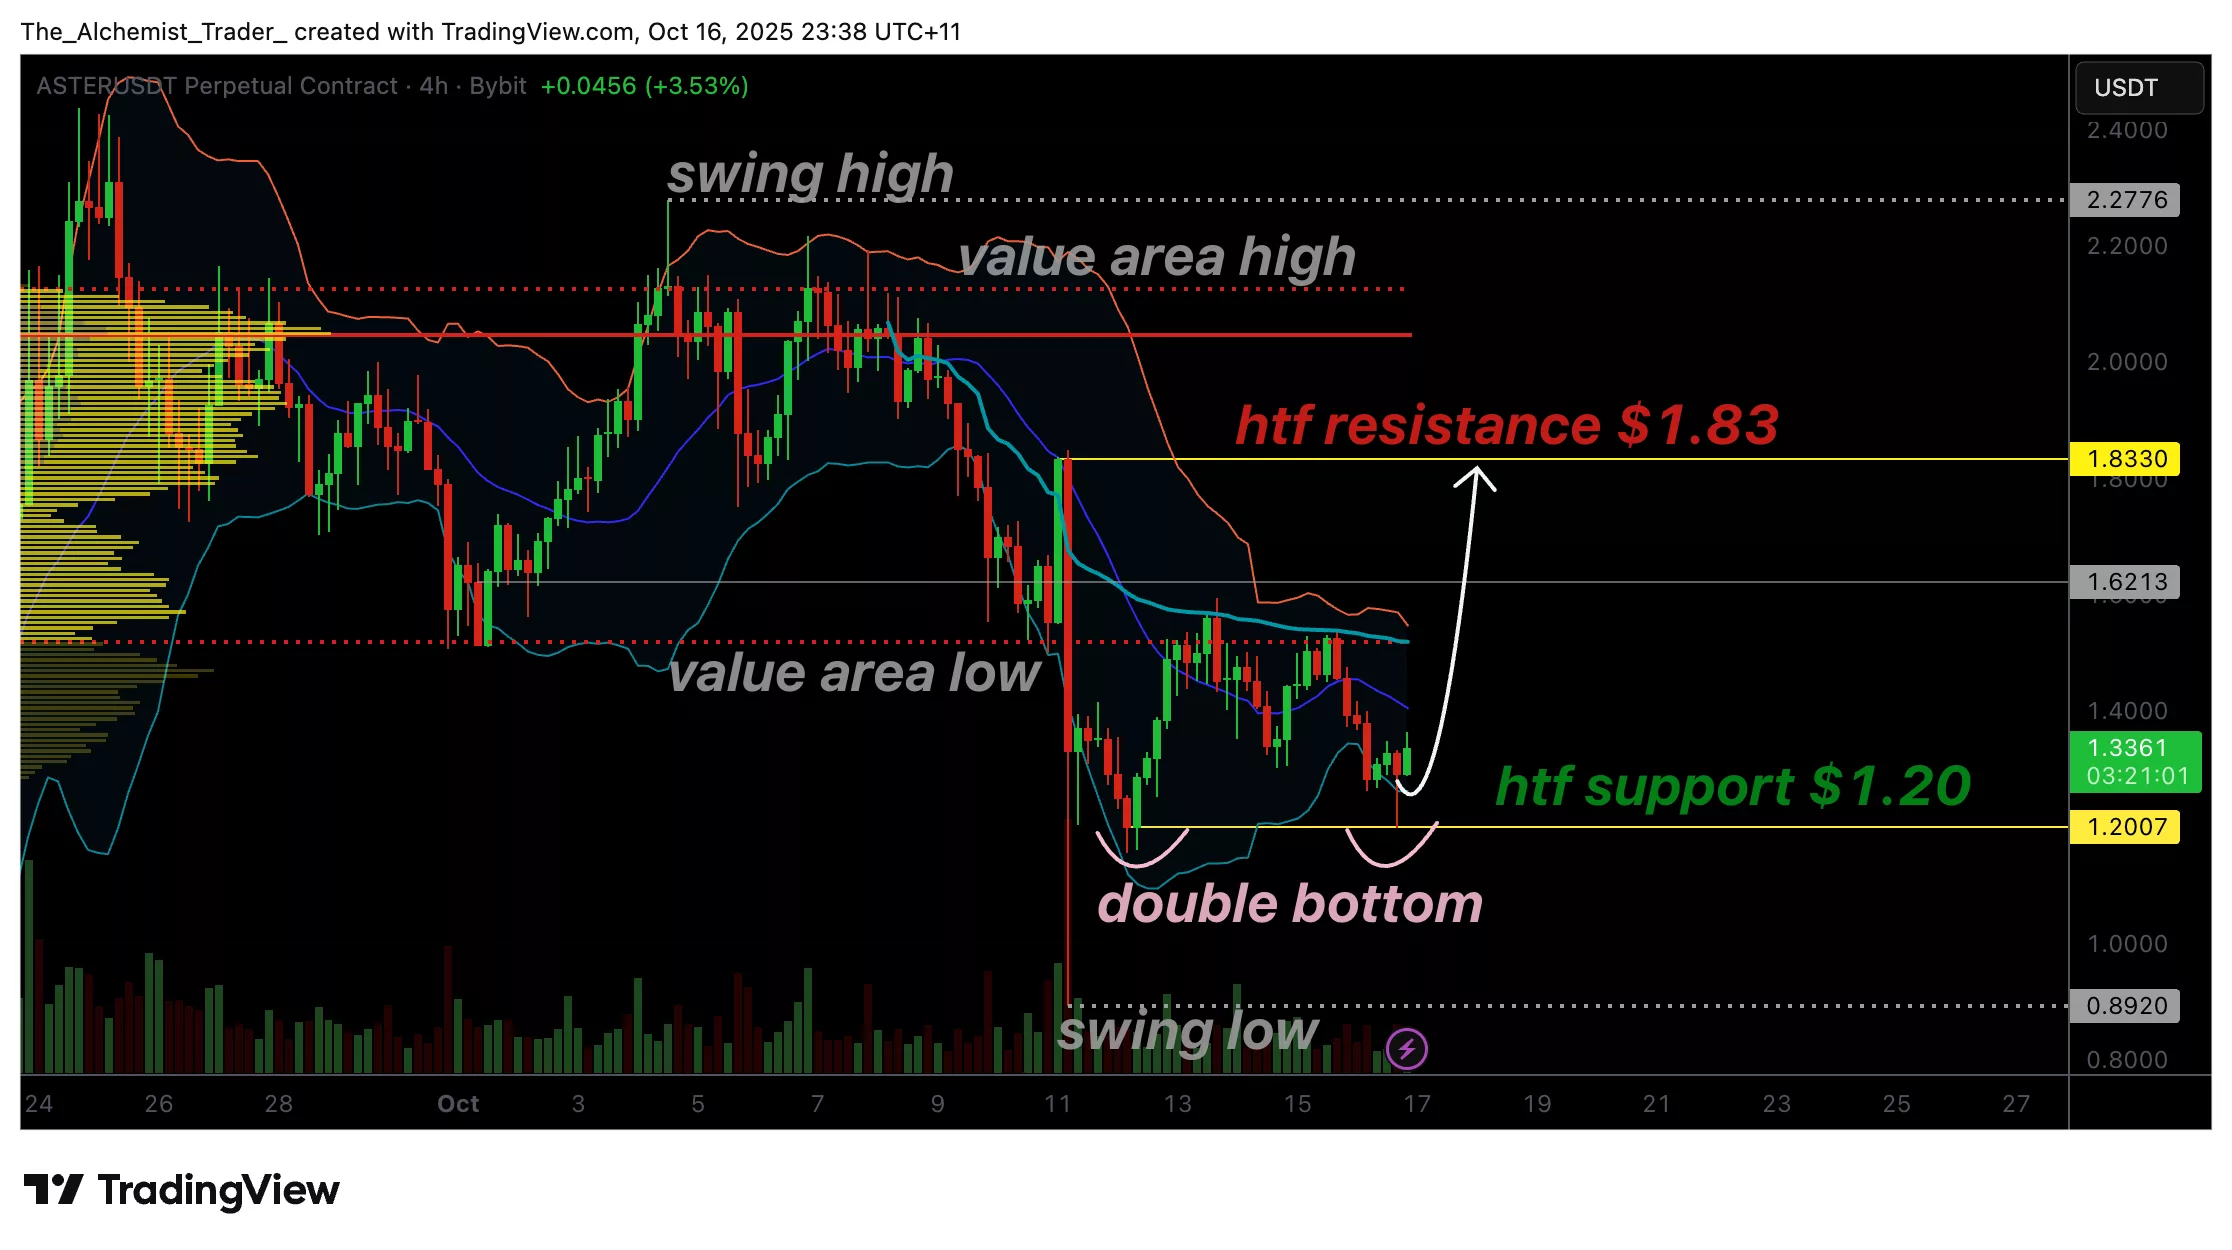
The $1.20 level has proven to be a key structural zone for Aster. The second retest of this support resulted in a clear bullish reaction, reinforcing the likelihood that this level represents the base of a broader reversal pattern. This double-bottom formation becomes increasingly valid as long as the asset continues to close above the value area low with growing buy-side volume.
The next major test lies at the $1.83 resistance, a region that has repeatedly rejected price advances in prior attempts. A decisive break and close above this level, ideally supported by an expansion in bullish volume, would confirm the structural shift from accumulation to expansion. Historically, such setups have preceded impulsive moves to the upside as traders recognize the pattern’s completion.
From a Fibonacci standpoint, the confluence of the 0.618 retracement level near $1.20 adds additional technical weight to the setup. This zone not only serves as a historical support level but also represents an area where institutional bids often cluster during reversal formations.
However, for this bullish scenario to materialize, Aster needs sustained buying pressure. Current volume profiles remain muted, indicating that market participants are still cautious. Without strong inflows or a rise in bullish nodes, any rally attempt could stall before confirming a breakout.
What to expect in the coming price action
As long as Aster holds above $1.20, the probability of a reversal continues to grow. A breakout above $1.83 would validate the double-bottom pattern and open the path toward higher targets. Conversely, a failure to sustain above $1.20 could invalidate the setup and lead to a deeper retest of lower supports.