Avalanche price targets 60% jump as AVAX burn rate jumps


Avalanche’s price has rebounded 160% from its lowest point on Friday as sentiment in the crypto market improved.
- Avalanche price has jumped by 160% from the year-to-date low.
- The AVAX burn rate has continued to accelerate this year.
- Technical analysis points to more gains, potentially to $36.
AVAX burn rate and transactions are soaring
Avalanche (AVAX) token soared to a high of $22.70, much higher than this month’s low of $8.92. This rebound may continue amid the ongoing AVAX token burns, transaction growth, and its growing market share.
Data show that the number of burned AVAX tokens has surpassed 4.8 million, now worth over $108 million. Most importantly, the average daily burn rate has climbed to about 1,500 per day, up from roughly 500 earlier this year.
The rising AVAX token burn happened as the amount of fees generated to the network continued growing. Data compiled by TokenTerminal shows that the network’s fees rose by 107% in September to $1.5 million, up from $710,000 in August. Avalanche burns all the fees it generates.
Avalanche’s network has benefited from its growing adoption. For example, it has become a major player in the real-world asset tokenization industry. Its RWA industry has over $746 million in assets, including those from Janus Henderson, BlackRock, and Franklin Templeton.
Avalanche’s stablecoin supply has jumped to over $2.7 billion as the number of stablecoin holders jumped to over 3.48 million.
Also, it has become a major player in the non-fungible tokens industry, where its volume jumped by 484% in the last seven days to $16.6 million. It has now become the second-biggest player in the NFT industry after Ethereum.
Avalanche’s transactions have also been in a strong uptrend in the past few months. Its transactions jumped to over 50 million in October. According to Nansen, transactions rose by 15% in the last 30 days to 49.7 million.
Avalanche price technical analysis
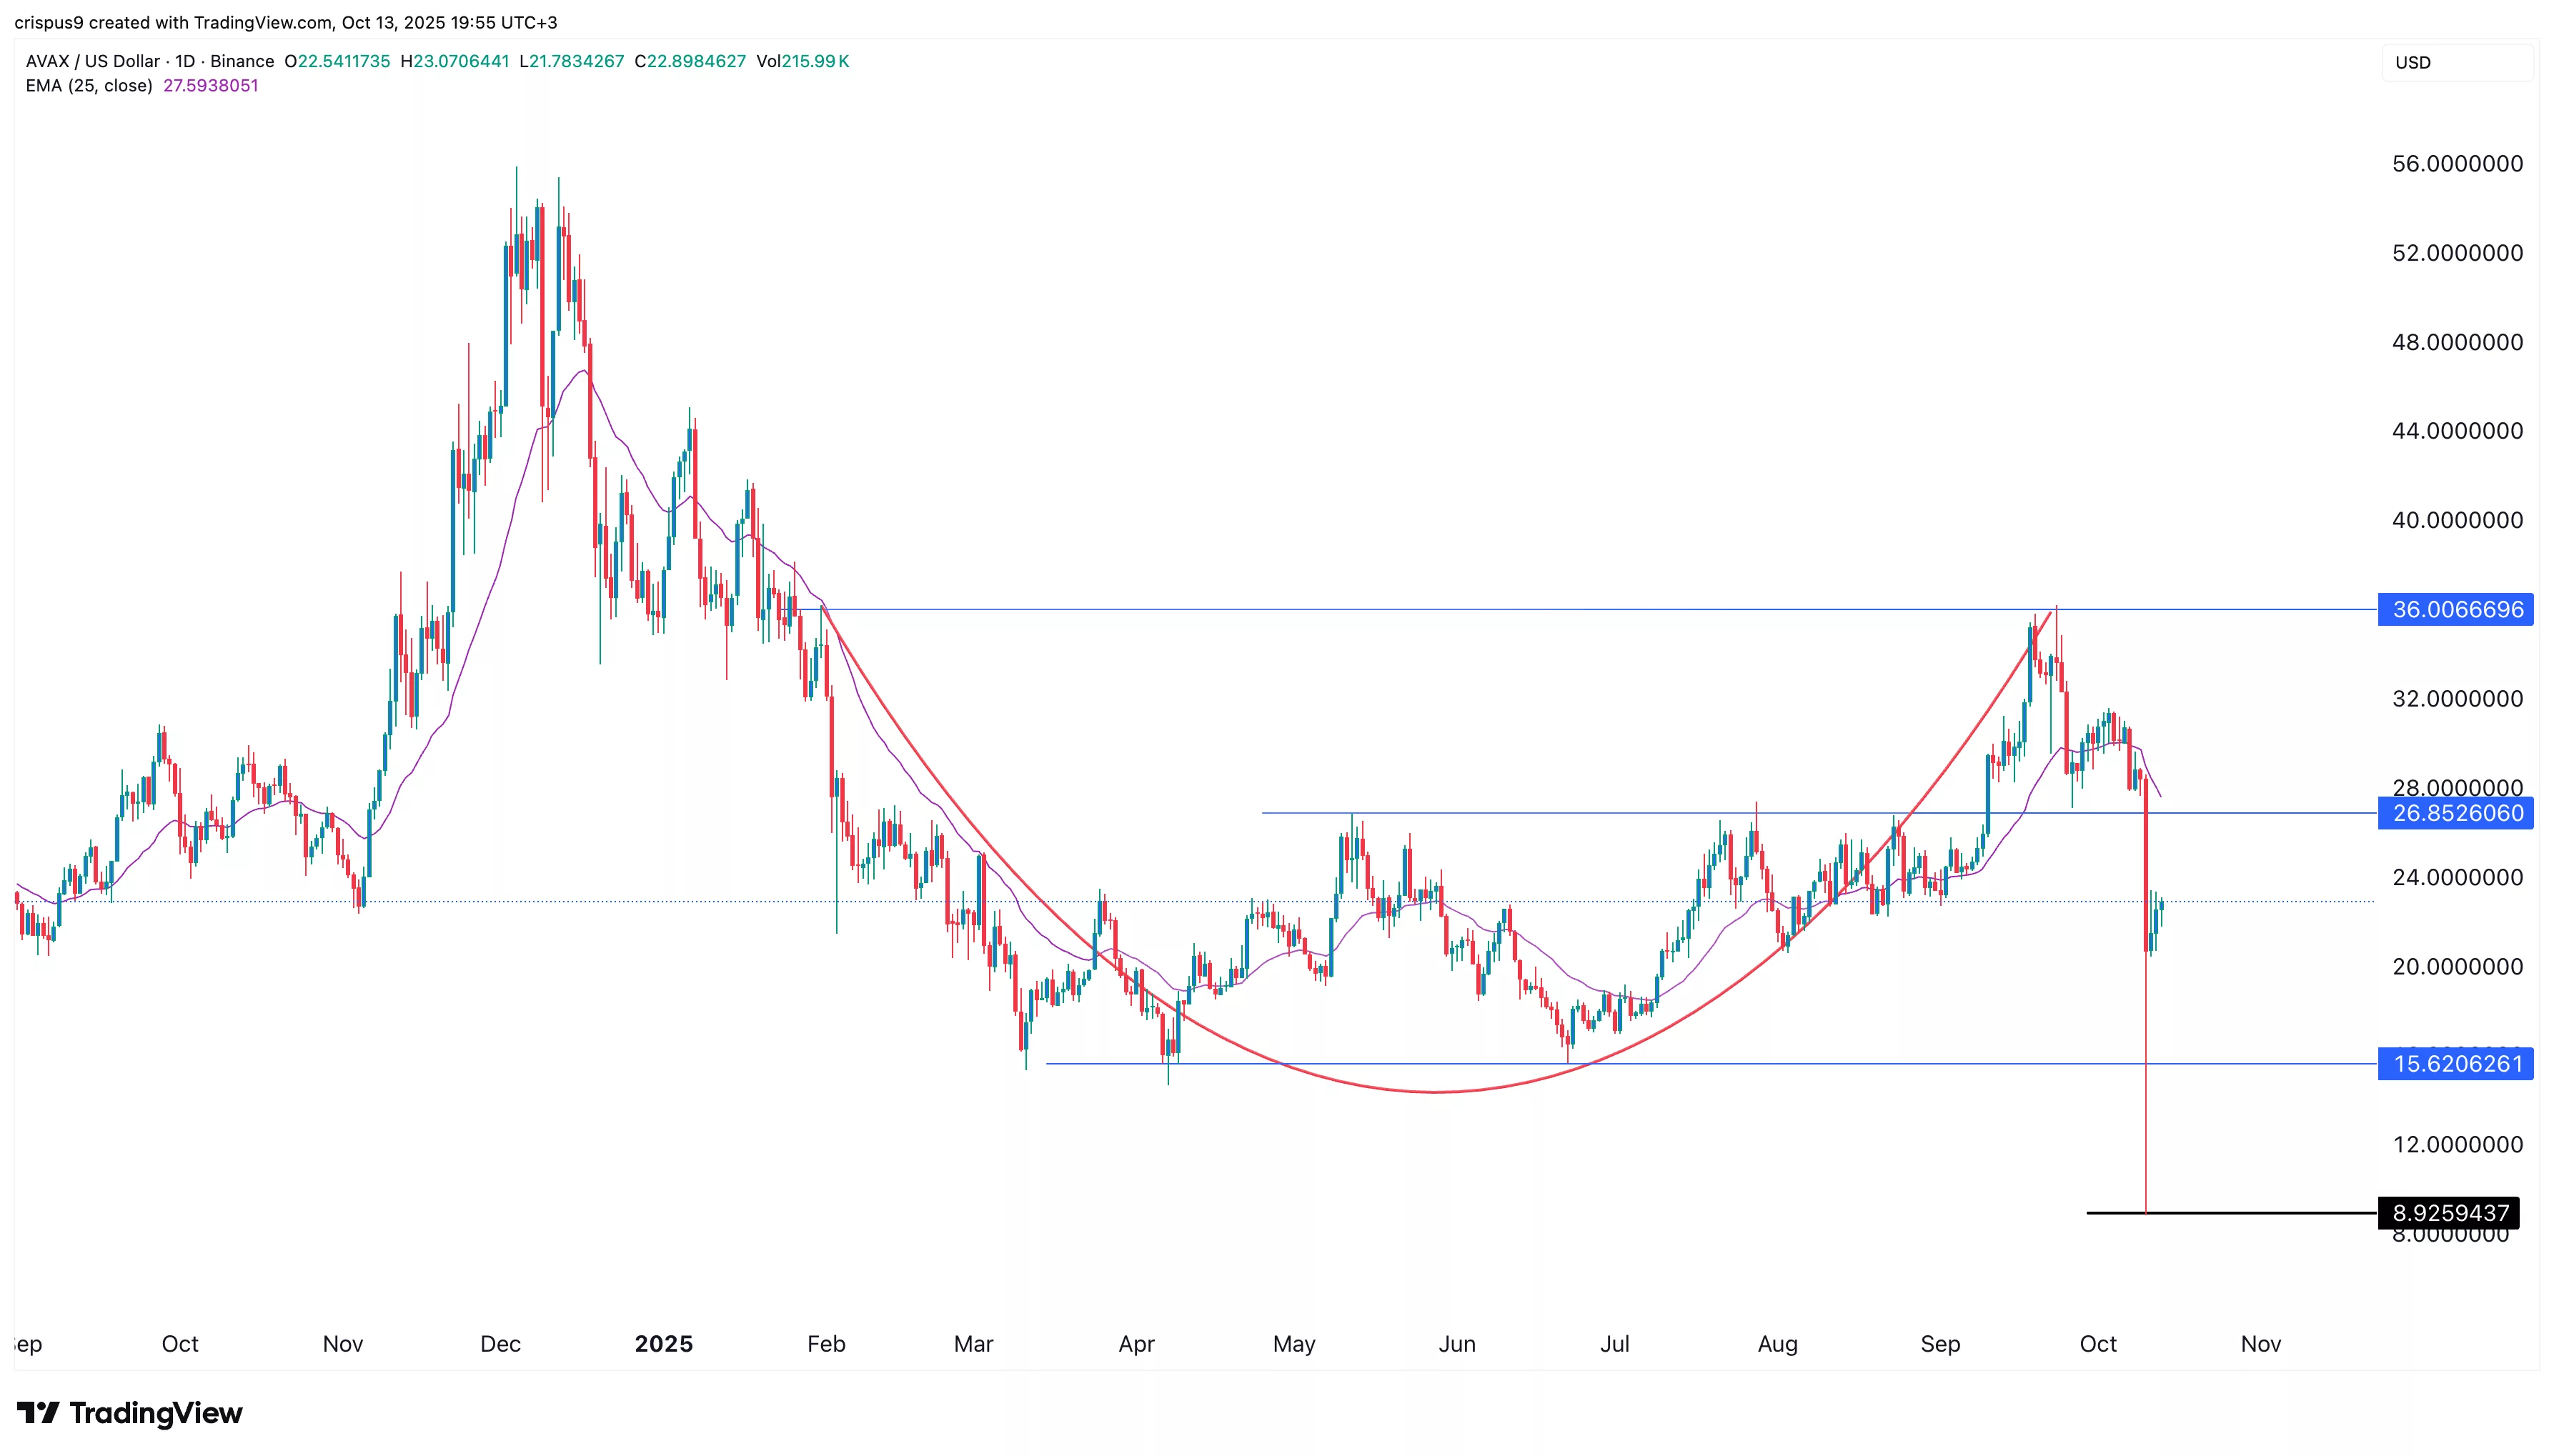
The daily time frame chart shows that AVAX has rebounded from a low of $8.9260 to $22.76. It formed a large hammer candlestick with a small body and a long lower shadow.
A hammer typically signals potential continuation after a sell-off. Bulls may target resistance at $26.52, the high from May and July.
A break above that level would point to further gains, potentially to $36, about 60% above the current level. A drop below the psychological $15 area would invalidate the bullish outlook.