Bitcoin and Ether Market Update April 21, 2022

The total crypto market cap added $115 billion to its valuation for the period since Monday and now stands at $1.92 trillion. The top ten coins were mostly in red for the last 24 hours with XRP (XRP) losing 2.2 percent while Polkadot (DOT) added 0.5 percent. At the time of writing bitcoin (BTC) is trading at $42,000. Ether (ETH) is at $3,105.
BTC/USD
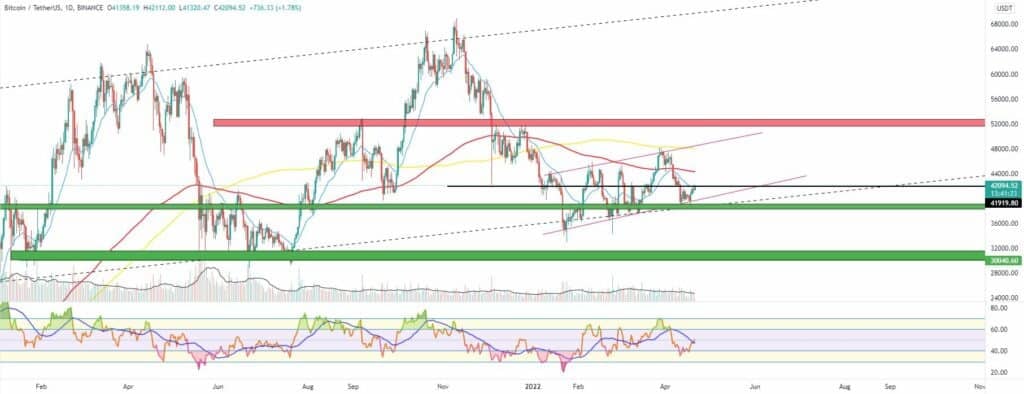
Bitcoin closed the trading day on Sunday, April 17 at $39,723 and after two days of intense selling reached the lower boundary of the mid-term uptrend corridor (or the final phase of the big bear flag pattern if you look at the bigger picture). The zone is right above the weekly horizontal support and the long-term uptrend corridor line.
Bitcoin ended the seven-day period with a 6 percent loss thus confirming its presence below the 21-period EMA on the weekly timeframe.
On Monday, bears were able to push the price all the way down to $38,600 to touch the mentioned long-term diagonal, but the high buying volumes helped the biggest cryptocurrency bounce back. The green daily candle fully engulfed the previous one as BTC closed at $40,812 with a 3.1 percent increase.
The Tuesday session was no different and the price continued to move in the upward direction, stopping at $41,500 in the evening. RSI was still above its moving average.
The third day of the workweek came with an unsuccessful attempt from buyers to break above the 21-day EMA and the zone above $42k. Bitcoin was moving up and down the $42,200 – $40,800 range before closing with a small loss.
What we are seeing midday on Thursday is a continuation of the uptrend as the price reached the mid-point of the mid-term channel.

ETH/USD
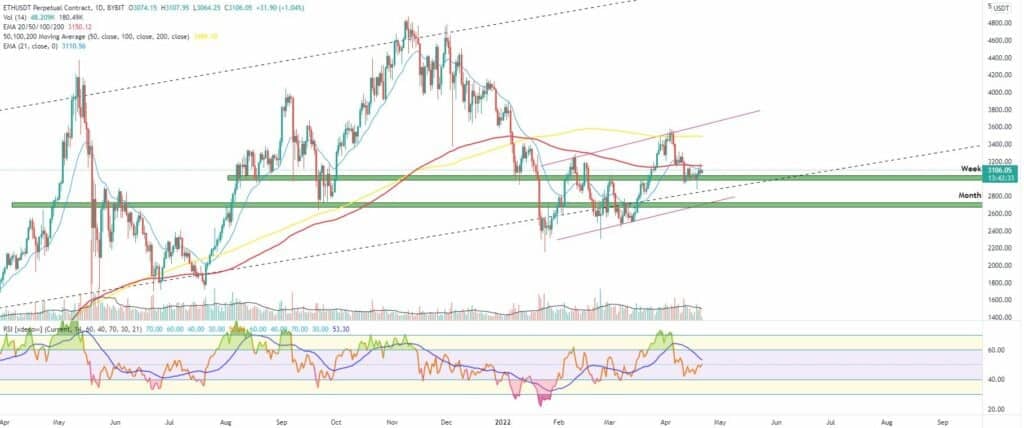
The Ethereum project token ETH closed the seven-day period at $2,984 after continuously testing the $3,000 level throughout the week. Buyers were considering this level as crucial for the mid to long-term effect on the price of the ether.
Still, it erased more than 6 percent of its market cap on a weekly basis falling below the 21-period EMA on the bigger timeframe.
On Monday, the ETH/USDT pair almost hit the lower boundary of the long-term uptrend corridor near $2,850 in the early hours of trading, but somehow managed to avoid a major crash by jumping up to $3,053 later in the session. As per the Volume profile indicator (VPVR) the area above $3,000 is one of the most actively traded on the chart.
Tuesday came with another green candle, this time to $3,100, close to the 21-day EMA.
The mid-week session on Wednesday was when bulls attempted a breakout. The price of ETH rallied to $3,200 but quickly retraced at the daily candle close, eventually closing in red.
The ether is currently trading slightly higher at the time of writing this market update, but still below the mentioned short-term EMA.


