Bitcoin and Ether Market Update August 11, 2022

The total crypto market cap increased by $25 billion for the period since Monday and now stands at $1,158 billion. The top ten coins are trading mostly in green for the last 24 hours with ether (ETH) and Solana (SOL) being the best performers with 11 and 10 percent of gains for the period respectively. At the time of writing bitcoin (BTC) is trading at $24,540. Ether (ETH) is at $1,892.
BTC/USD
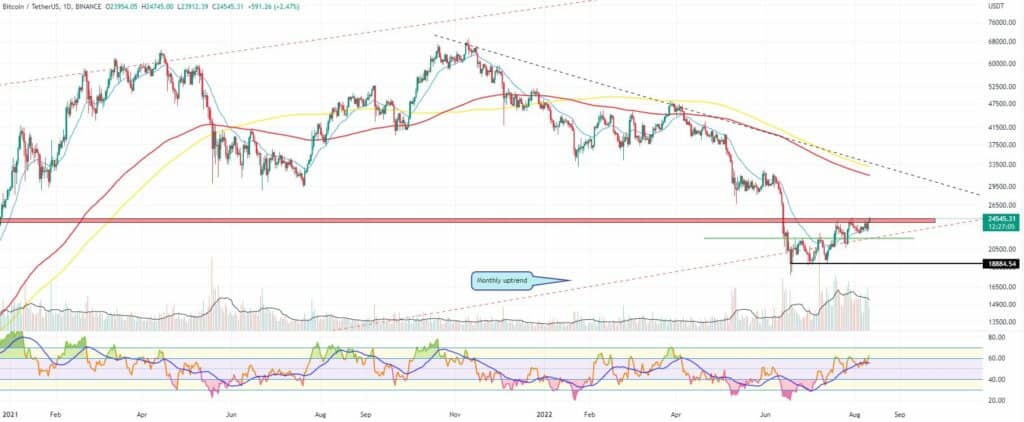
Bitcoin ended the previous seven-day period at $23,200 and with less than a percent loss. Bulls continued to push upwards and managed to find stability above the 200-day Moving Average (MA) on the weekly timeframe which usually signals a bullish reversal.
On Monday, August 8 the BTC/USDT pair climbed up to $23,800 but not before hitting a daily high of $24,200 during intraday trading. The entire area in the $23,900 – $24,500 range should be considered a resistance.
Bears pushed the price of BTC down to $23,166 on Tuesday fully erasing all gains from the day before. Still, the 21-day EMA provided the needed dynamic support on the daily chart.
The uptrend was resumed on the third day of the workweek. The biggest cryptocurrency moved up to $23,900 increasing by 3.5 percent for the session. It is worth noting that the coin was trading in the wide range between $22,600 – $24,200 throughout the day before finally choosing a direction.
What we are seeing midday on Thursday is a breakout attempt. Bitcoin is flirting with the upper boundary of the mentioned resistance area. However, bulls have to be extremely careful and watch out for a potential double top formation on the daily timeframe as well as a bear flag on the weekly.
The price is currently hovering around $24,500.

ETH/USD
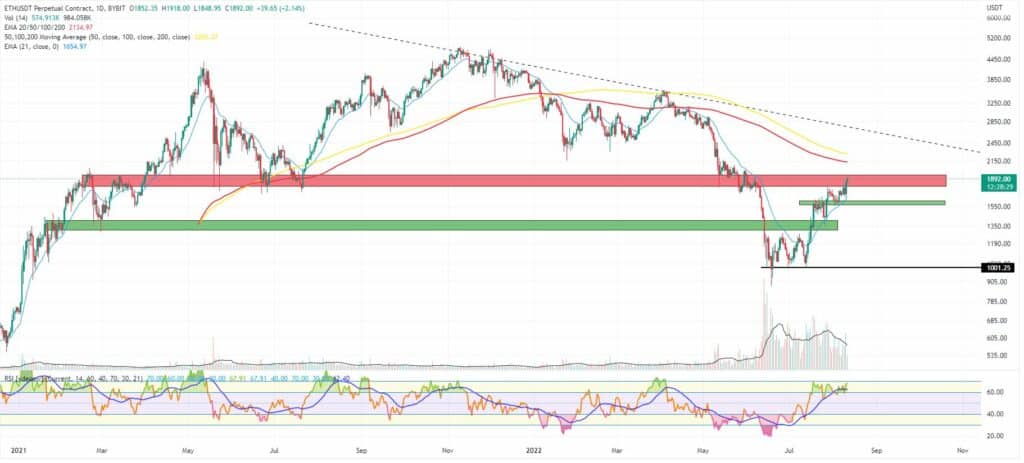
The Ethereum Project token ETH closed its fifth consecutive weekly candle in green on Sunday, August 7. It added 1.5 percent to its valuation on a seven-day basis making it a total of 92 percent since hitting a 1.5-year-low of $886 in mid-June.
On Monday, the ether jumped 4.7 percent up to $1,783 once again hitting the horizontal resistance. This time again bulls were rejected there, so they were forced to retreat down to $1,700 on Tuesday losing 4.4 percent of the ETH’s market cap.
The Relative Strength Index (RSI) has been in the overbought area since mid-July while the 24-hour trading volumes remained below the average. They were also decreasing in divergence with the price rally.
If we go to the weekly chart, however, we could see that the ETH token is still not in the overbought zone and with a lot bigger trading volumes than during the entire June 2021 – June 2022 period.
The ETH/USDT pair jumped 9.5 percent on the good inflation data from the United States thus reaching the $1,846 mark and entering the resistance zone.
The $1,900 – $1,950 is a solid support/resistance on the bigger timeframes and this time it is in sync with the 21-period EMA weekly.
The leading altcoin is trading slightly higher – at $1,894 midday on Thursday.


