Bitcoin and Ether Market Update December 30, 2021

Total crypto market cap erased $169 billion from its value for the period since Monday and now stands at $2.23 trillion. The top ten coins are mostly in green for the last 24 hours with Terra (LUNA) and XRP (XRP) leading the group with a 2.9 and 2.2 percent of increase to their respective values. At the time of writing bitcoin (BTC) is trading at $47,659. Ether (ETH) is at $3,747.
BTC/USD
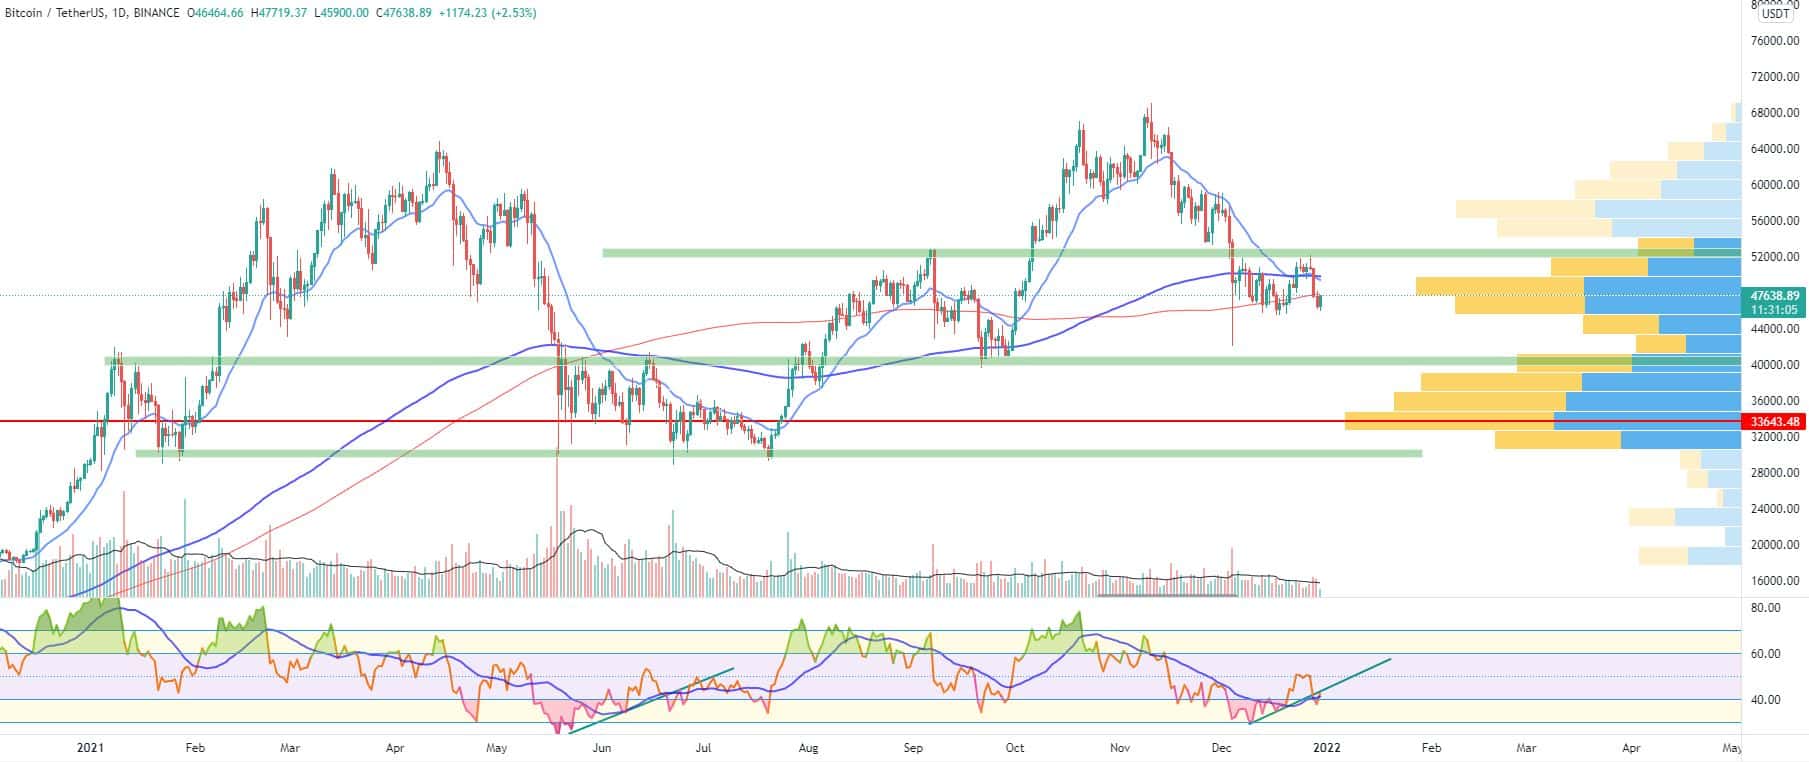
Bitcoin closed the trading day on Sunday, December 26 at $50,770. Bulls managed to push the price above the 21 and 200-day moving averages once again and ended the seven-day period with an 8 percent of increase, also engulfing the previous candle on the weekly timeframe.
However, we could clearly see a head and shoulders pattern being built on both the daily and weekly timeframes with the right shoulders expected to form right above the $52,000 mark. It is also worth noting that the biggest cryptocurrency is still trading below the 21-period EMA on the weekly timeframe, which usually means bears are in control.
The BTC/USDT pair remained flat at the end of the trading session on Monday after failing to break above the mentioned resistance at around $52k. The coin has been unable to surpass it since December 4, adding to its stability.
Sellers came out strong on Tuesday, December 28 pushing the price down to $47,600, which resulted in a 6 percent decrease and the confirmation of the right shoulder formation. A break below the $41,000 zone where the neckline is located would fully close the pattern.
The mid-week session on Wednesday brought no change in the market behavior. Bitcoin fell further down to $46,440 and lost the volume profile biggest zone in this area.
What we are seeing midday on Thursday is some renewed activity from bulls as BTC is 2 percent up for the day.

ETH/USD
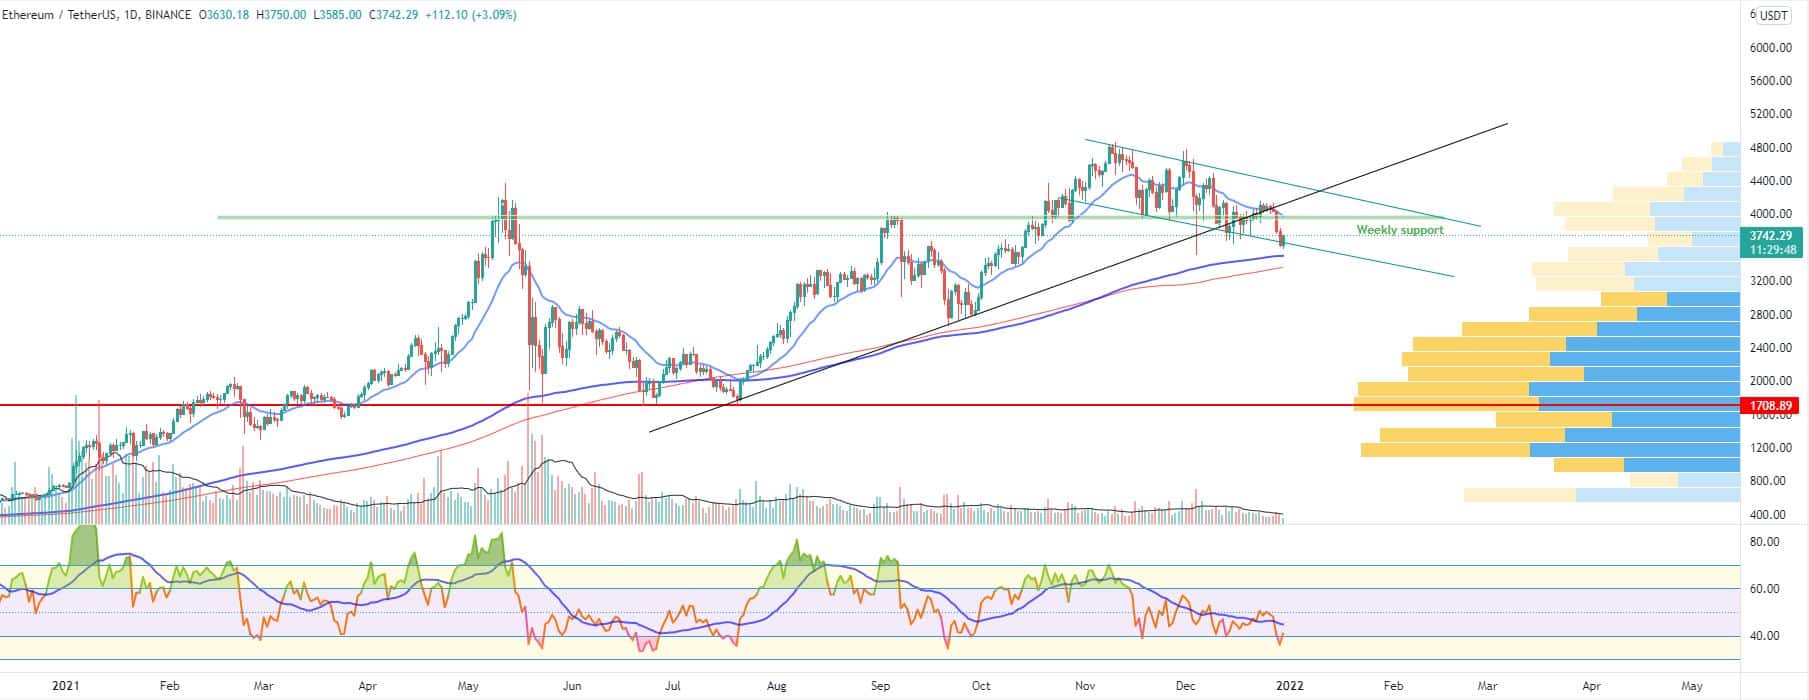
The Ethereum Project token ETH ended the last seven-day period in green even though it dropped down to $4,064 on Sunday, once again touching the diagonal support line. The coin, however, successfully found some stability around this uptrend line and added 3 percent to its valuation on a weekly basis.
As mentioned on Monday, the ETH/USDT pair was drawing a bear flag within a bull flag (with the current downtrend channel on the daily timeframe serving as the flag). Meaning that the recent rapid increase in its price, combined with the low volumes could easily result in a reversal to the downside.
On Monday, December 27, the ether moved down to $4,040 and lost the 21-day EMA.
Then on Tuesday, it broke below the extremely solid weekly support, eventually closing the session at $3,786 with a 5.8 percent loss.
The move was followed by a third consecutive day in red the coin re-visited the zone around $3,635 for the first time since the December 4 flash crash.
Still, the selling pressure started to ease on Thursday and as of the time of writing, the ETH token is trading a little bit higher – at $3,740 with a 3 percent of a price increase. The lower boundary of the mentioned downtrend channel on the daily timeframe provided the needed stability.


