Bitcoin and ether market update Feb. 9

Total crypto market cap lost $2 billion for the period since Monday and now stands at $1,061 billion. The top ten currencies are mostly in red for the day with only Polygon (MATIC) registering some gains, currently up by 3.3 percent. At the time of writing bitcoin (BTC) is trading at $22,700. Ether (ETH) is at $1,635.
BTC/USD
Bitcoin closed the trading day on Sunday, February 5 at $22,927 making it a total of four consecutive days in red since it peaked at $24,240 on February 2. The break above the important monthly horizontal resistance could not be confirmed and the last high on the 1-month timeframe and the 200-period Exponential Moving Average (EMA) remained the next big resistance cluster in front of bulls.
All this resulted in a 3.4 drop on a weekly basis and an overall correction in the crypto market.
On Monday, the BTC/USDT pair fell to $22,750. Traders were starting to look at the lower timeframe support areas and $22,600 was one of them that was formed after the January, 20 breakouts.
The Tuesday session was slightly different and the biggest cryptocurrency jumped up to $23,260 touching the above-mentioned monthly resistance line.
The mid-wee trading on Wednesday came with higher volatility as the price was moving in the narrow $23,400 – $22,700 before closing in red.
What we are seeing early on Thursday is a continuation of the price pullback. The short 21-day EMA was hit for the first time since January 6 and the overall market structure starts to look a lot like the infamous Bart Simpson pattern, which usually suggests a deeper correction is coming.
Looking at the daily timeframe chart, it is the $21,000-$20,600 zone that can provide short to mid-term stability as an important point of interest for traders in the last 6-7 months.
A confirmed, clean break above $23,300 on the higher timeframes on the other can be seen as a positive sign from bulls.

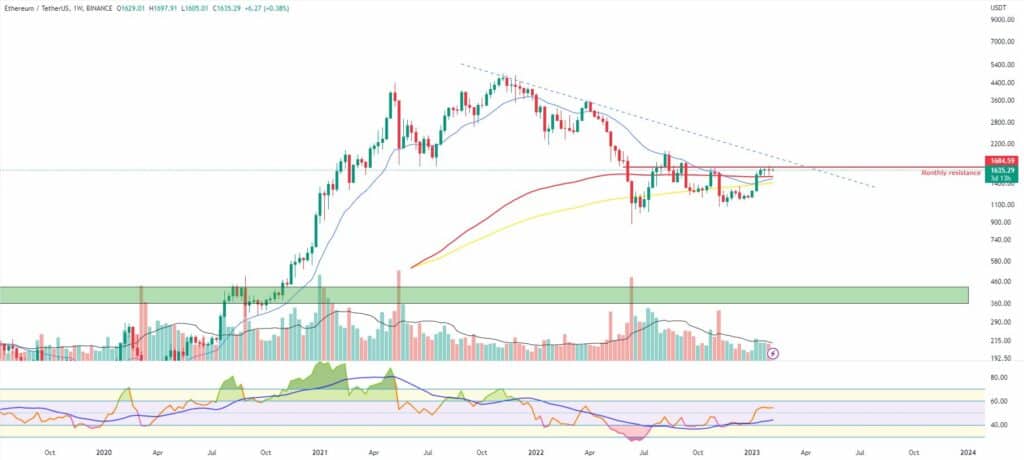
ETH/USD
The Ethereum Project ETH closed the last seven-day period at $1,630 and with a little more than a percent loss. The week of January, 30 – February, 5 was marked by high volatility as the ether continues to be caught between the monthly timeframe resistance line and the $1,600 level which marks the last weekly high.
On Monday, the ETH/USDT pair fell further down to $1,616 as the Relative Strength Index (RSI) was already reset on the daily timeframe chart.
The Tuesday session brought a fresh 3.5 percent increase in the price of ETH, but it remained rangebound. In addition to that it was slowly starting to build something between an Ascending triangle formation and a Rising Wedge both of which can result in a bearish breakdown if rejected at their upper boundaries.
The third day of the workweek came with an early push to $1,700, which only proved to be unsustainable later in the session.
As of the time of writing this market update, the leading altcoin is trading at $1,640 bouncing up from the 21-day EMA.