Bitcoin and ether market update, Jan. 19

The total crypto market cap is down by $9 billion for the period since Monday and now stands at $967 billion. The top ten currencies are all in red for the day, with dogecoin (DOGE) and polygon (MATIC) being the worst performers, with 5.2% and 4.4% of losses respectively. At the time of writing bitcoin (BTC) is trading at $20,790. Ether (ETH) is at $1,524.
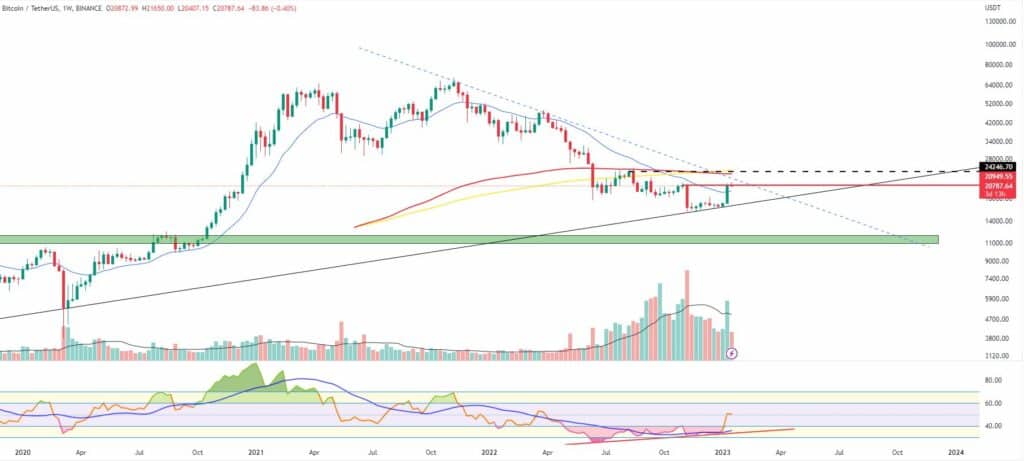
BTC/USD
Bitcoin closed the trading day on Sunday, Jan. 15, flat at $20,880 – the last formed lower high on the weekly timeframe chart, which was the next major resistance in front of bulls.
The coin also hit the 200-day EMA for the first time since Apr. 6, 2022, which ended its 7-day-long streak of green candles.
The price rally, however, resulted in a 22% increase on a weekly basis – the biggest one-week jump since February 2021.
On Monday, the new trading period started with a continuation of the uptrend. During intraday, BTC touched the $21,500 mark and closed the session at $21,200. The Relative Strength Index (RSI) was already in the overbought zone as the 24-hour trading volumes remained stable above the 14-day average.
Buyers attempted to consolidate and push the price above $22,000 but were rejected right above the mentioned EMA, closing Tuesday flat.
The third day of the workweek came with high volatility and dropped to $20,673 in the evening as the United States Department of Justice charged the Hong Kong-registered exchange Bitzlato with money laundering in a major announcement that colored the market in the red.
On the 1-week chart, $20,900 remains the closest and most important horizontal resistance, while the biggest cryptocurrency is stable above the 21-period EMA and the long-term uptrend diagonal support.
What we are seeing early on Thursday is a short green candle to $20,800.
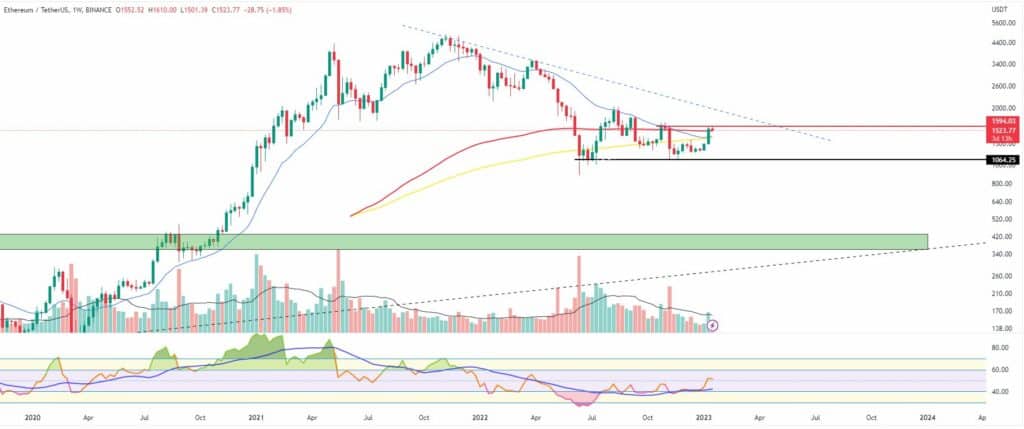
ETH/USD
The Ethereum Project token ETH followed BTC closely on its way up, adding 20% to its valuation for the last seven days. The coin successfully broke out of the Bearish Pennant formation, fully invalidating it, and also managed to surpass all major EMAs on the daily timeframe chart.
On Monday, January 16 the ETH/USDT pair formed its ninth consecutive green candle and moved further up to $1,580. The ether even managed to briefly climb above the $1,600 mark, the second-lowest high formed on the weekly chart before the market changed its direction.
The Tuesday session dropped to $1,560 as the RSI reverted to the downside while the trading volumes remained slightly below the 14-day average.
The mid-week session on Wednesday came with another rejection at $1,600 – the fourth in the last five trading days. The leading altcoin was highly volatile, moving in the $1,600-$1,500 area before closing at $1,511 at the 200-day EMA.
The last two tops on the 1D chart and the price action between them can be interpreted as a Cup and Handle pattern with a breakout point at $1,600.
As of the time of writing this market update, the ether is trading slightly higher – at $1,524.