Bitcoin and Ether Market Update June 9, 2022

The total crypto market cap erased $43 billion from its valuation for the period since Monday and now stands at $1.24 trillion. The top ten coins showed mixed results for the last 24 hours with Solana (SOL) and Cardano (ADA) being the biggest gainers with a 5.5 and 1.85 percent increase respectively. At the time of writing bitcoin (BTC) is trading at $30,410. Ether (ETH) is at $1,810.
BTC/USD
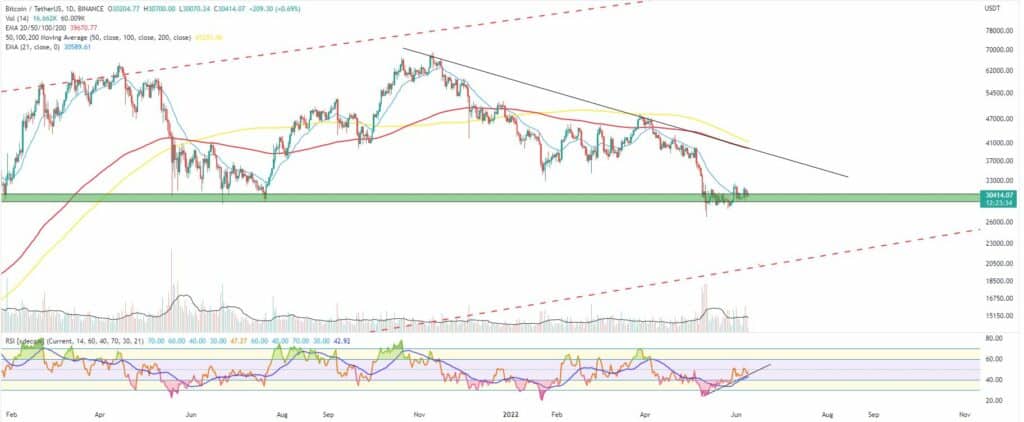
Bitcoin ended the last seven-day period with its first green weekly candle since the end of March thus breaking the losing streak. However, this move looked rather weak and more like a temporary consolidation before the next leg down as part of the general downtrend. The coin closed the Sunday trading at $29,959 still below the July 2021 lowest weekly candle close but above the mid-term horizontal support at $28,500.
On Monday, June 6, the BTC/USDT pair made an unexpected break above the 21-day EMA on the daily timeframe chart and hit the $31,800 mark while adding 4.7 percent to its market cap for the day. The 24-hour trading volumes briefly jumped above the average value for the last 14 sessions. We could still see a bullish divergence between the current price action and the Relative Strength Index (RSI) which crossed its middle level.
The Tuesday session brought us a full retrace of the solid green candle we just mentioned above in the morning hours of trading. BTC corrected its price down to $29,400 before climbing back up to $31,100 in the evening.
The mid-week trading day on Wednesday came with another break below the 21-day EMA as the biggest cryptocurrency was struggling to choose a direction. It fell down to $30,173 losing 2.8 percent.
As of the time of writing, bulls are pushing the price up, but the volumes are not stable enough to support a breakout.

ETH/USD
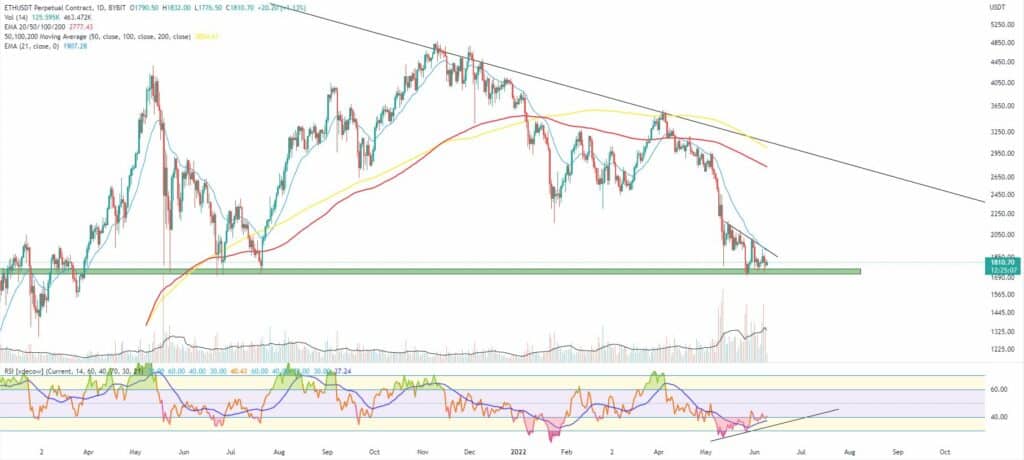
The Ethereum project token ETH was not able to turn green at the last weekly candle close and instead closed its ninth consecutive seven-day period in red. Still, the good news for buyers was that the coin managed to keep trading above the long-term horizontal support right above $1,700. However, support gets weaker and weaker with every test, so the most probable scenario here will be a short rally in the upward direction to collect liquidity before attempting a major break downwards.
On Monday, June 6 the ETH/USDT pair climbed up for the third day in a row reaching the $1,925 mark before closing a little bit lower – at $1,861 later in the evening.
The coin was still trading below the 21-day EMA and the short-term diagonal resistance but the trading range was getting narrower suggesting a potential breakout in either direction is imminent.
On Tuesday, the ether once again tested the already-mentioned support and corrected its price down to $1,810.
The third day of the workweek came with a drop to $1,790 and the coin was now clearly in a pennant formation that can result in a downtrend continuation.
ETH is trading slightly higher at $1,810midday on Thursday.


