Bitcoin and Ether Market Update March 24, 2022

Total crypto market cap added $84 billion to its value for the period since Monday and now stands at $1.96 trillion. The top ten coins were all in green for the last 24 hours with Cardano (ADA) and Solana (SOL) leading the group with 16.8 and 9.5 percent of gains respectively. At the time of writing bitcoin (BTC) is trading at $44,888. Ether (ETH) is at $3,045.
BTC/USD
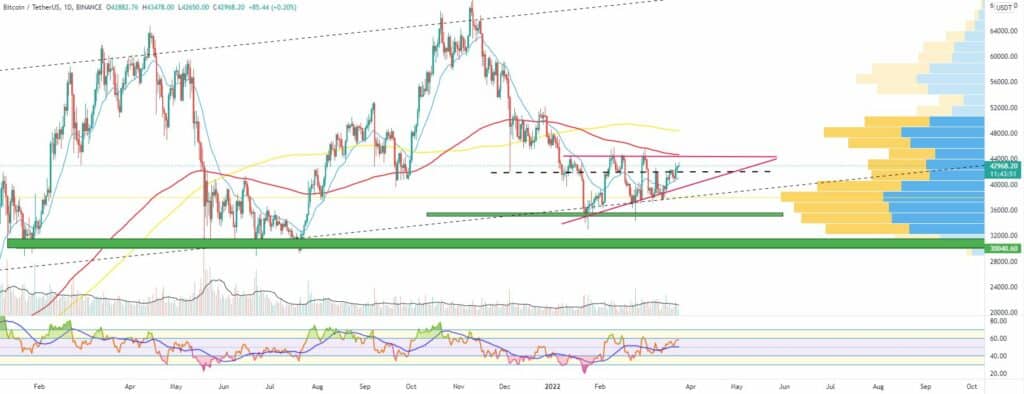
Bitcoin closed the trading on Sunday, March 20 at $41,166 after hitting the weekly resistance level at $42,000 on Saturday evening. The coin ended its six-day long uptrend but still registered a 9.5 percent increase on a weekly basis.
Not only that but BTC managed to rebound perfectly from the lower boundary of the long-term weekly uptrend corridor.
On Monday, bears pushed the price further down to hit the 21-day EMA near $40,670 before closing the day at $41,030 with a small loss.
The uptrend was resumed on Tuesday, March 22 when BTC climbed up to $42,300, moving above the mentioned horizontal resistance and adding 3.5 percent to its valuation. It is worth noting that the leading cryptocurrency was still trading in an ascending triangle figure on the daily chart making the zone above $44,000 the next major obstacle.
The mid-week session on Wednesday came with a second consecutive day in green. Bitcoin extended its gains by visiting $42,910. Trading volumes remain below average for the last 14 days while the RSI index is still below the overbought zone.
What we are seeing midday on Thursday is flat trading, BTC is hovering around $43,000.
Next for bulls is to consolidate above the $42,000 mark at the weekly candle close and look to surpass the 21-period EMA on the bigger timeframes. This is to be followed by a break above the ascending triangle.

ETH/USD
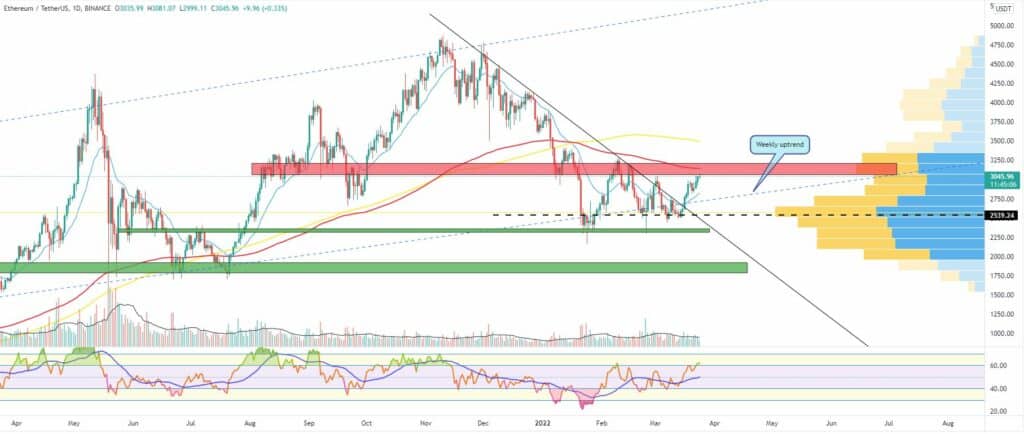
The Ethereum project token ETH successfully surpassed all major short to mid-term resistances last week. It broke above both the 21-day EMA and the diagonal downtrend line and also was able to re-enter the long-term trading corridor.
It added 13.6 percent to its valuation for the last seven days establishing the $2,500 mark as a solid macro-support. On Sunday, March 20 we saw a pullback to the zone around $2,862 which resulted in a 2.6 percent loss. This was the first red candle on the daily chart for the last seven sessions.
On Monday, the ETH/USDT pair resumed the uptrend. It ended the session at $2,897 but not before hitting $2,966 during intraday.
Bulls continued to push on Tuesday as the ether reached the solid horizontal resistance in the $3,000-$3,200 area. The move resulted in another 2.5 percent being added to its valuation.
The third day of the workweek was no different and ETH reached $3,035 as 24-hour trading volumes were stable at the average for the last 14 days. The RSI indicator entered the overbought area.
The next resistance in front of buyers is the 21-EMA on the weekly chart (currently at $3,120) and the mentioned $3,000-$3,200 horizontal resistance.
The coin is currently trading at $3,052.


