Bitcoin and Ether Market Update May 19, 2022

The total crypto market cap erased $35 billion from its valuation for the period since Monday and now stands at $1.23 trillion. The top ten coins were all in red for the last 24 hours with Solana (SOL) and Cardano (ADA) being the worst performers with 9.8 and 8.2 percent of losses respectively. At the time of writing bitcoin (BTC) is trading at $29,243. Ether (ETH) is at $1,940.
BTC/USD
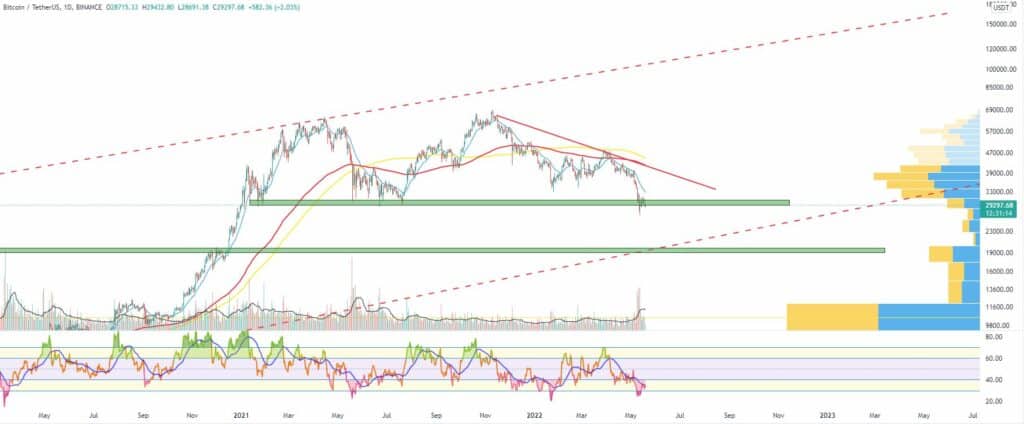
Bitcoin rallied all the way up to $31,400 at the end of last week making it a total of 8.2 percent of price increase for the period from Friday to Sunday. The coin ended the last seven days with a 7.5 percent loss but was still 17 percent above its weekly low of $26,703. The Relative Strength Index (RSI) reached the 33 mark in the oversold zone for the first time since March 2020 on the bigger timeframe chart.
On Monday, May 16 the BTC/USDT pair dropped all the way down to $29,100 before closing the session at $29,850 erasing all gains from the previous day. The January 2021 and July 2021 bottoms once again were acting as a strong support/resistance area.
The biggest cryptocurrency jumped back up to $30,467 on Tuesday, but the bullish momentum was not on its side. We could clearly see the formation of a bear flag pattern on the 4-hour chart with the potential to push the price further down to the sub-$25,000 zone and somewhere near the 200-period EMA on the weekly chart.
The third day of the workweek came with another huge red candle, this time to $28,700 – below the already mentioned multi-timeframe horizontal support.
The 24-hour volumes were once again below their 14-day average value.
What we are seeing midday on Thursday is a temporary reversal. BTC is trading at $29,300.

ETH/USD
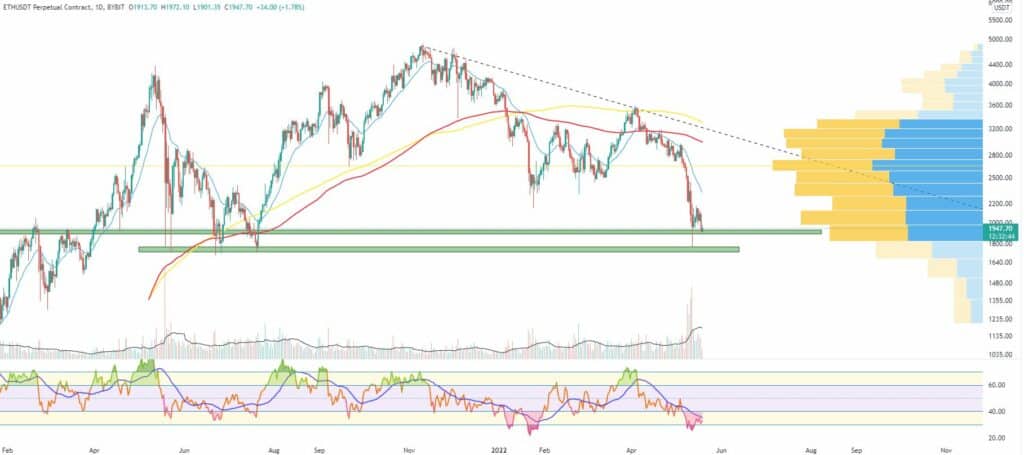
Bulls pushed the price of ETH up to $2,150 on Sunday, May 15 which resulted in a 9.6 percent of price increase for the three-day period and 21.5 percent since the coin bottomed at $1,778 on May 12. Still, it registered its sixth consecutive week in red, trading below most of the major support levels except for the long-term horizontal support above $1,700.
In terms of trading volumes, the ether was seeing values below the average for the last 14 sessions. The RSI indicator was at its lowest point since January 2022 on the daily timeframe chart.
On Monday, the ETH/USDT pair fell 5.6 percent down to the area around $2,026. It was forming a rising wedge bearish pattern on the lower-timeframe 4-hour chart where it was rejected on that day.
On Tuesday, May 17 it hit the lower boundary of the wedge bouncing up from it to close the day in green and at $2,090.
The mid-week session on Wednesday came with a successful break below the lower line of the mentioned figure and a 5.6 loss for the ETH token. Next major support (if $1,900 fails) is the $1,700-$1,750 zone.
The leading altcoins is currently trading at $1,950.


