Bitcoin and Ether Market Update May 20, 2021

Total crypto market cap erased $393 billion from its value for the period since Monday and now stands at $1.73 trillion. The top ten coins are all in red for the last 24 hours with all of them registering double-digit losses. Polkadot (DOT) was the worst performed with a 25 percent loss. At the time of writing bitcoin (BTC) is trading at $40,460, ether (ETH) nosedived to $2,710.
BTC/USD
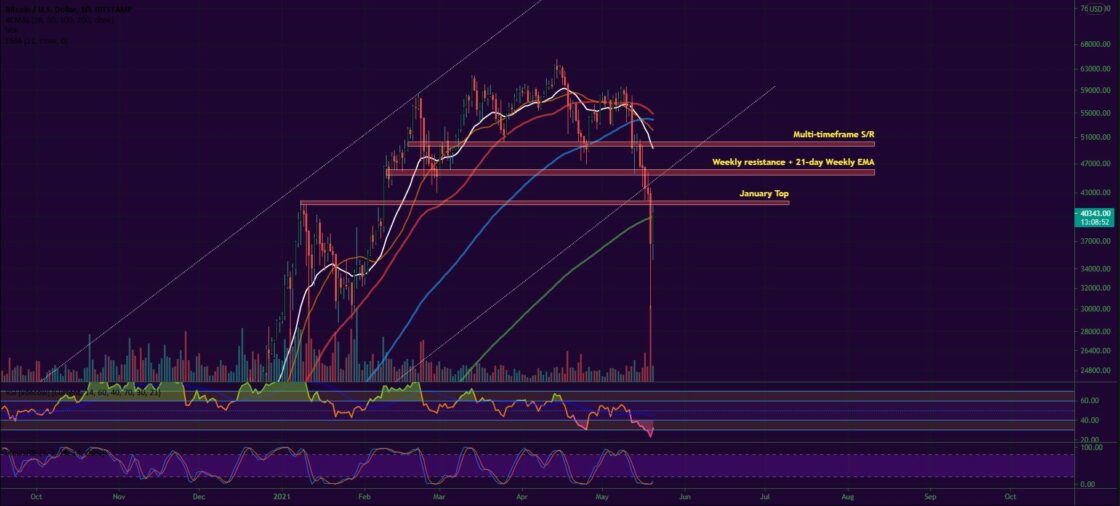
Bitcoin closed the trading session on Sunday, May 16 at $46,420 after trading in the wide range between $49,600 and $43,800 during intraday. The BTC/USDT pair was 20 percent down on a weekly basis. The sudden sell-off was mainly triggered by the fact the coin was struggling to surpass the weekly horizontal resistance situated in the $58,000-$59,000 zone for more than 2 months. Additionally, we could clearly see a diamond pattern bearish signal on the daily chart, which combined with the declining trend strength indicators were in favor of a major price correction.
On Monday, the biggest cryptocurrency broke below the 21-day EMA on the weekly timeframe and hit the lower boundary of the long-term uptrend corridor, closing the day near $43,600, which corresponded to a 6 percent decline.
The Tuesday session was the fourth consecutive in red for BTC. This time the coin temporarily recovered to $45,500 but was rejected there, proving that the zone has turned from support to resistance, thanks to the weekly levels. Bears managed to push the price down to $42,800 at the candle close.
The mid-week session on Wednesday was no different and bitcoin continued to slide, moving below the January high of $42,000 and briefly touching the sub-$30k zone. It ended the day at $36,800 – its lowest point since February 3, 2021.
What we are seeing midday on Thursday is a 9.6 percent jump to $40,400.

ETH/USD
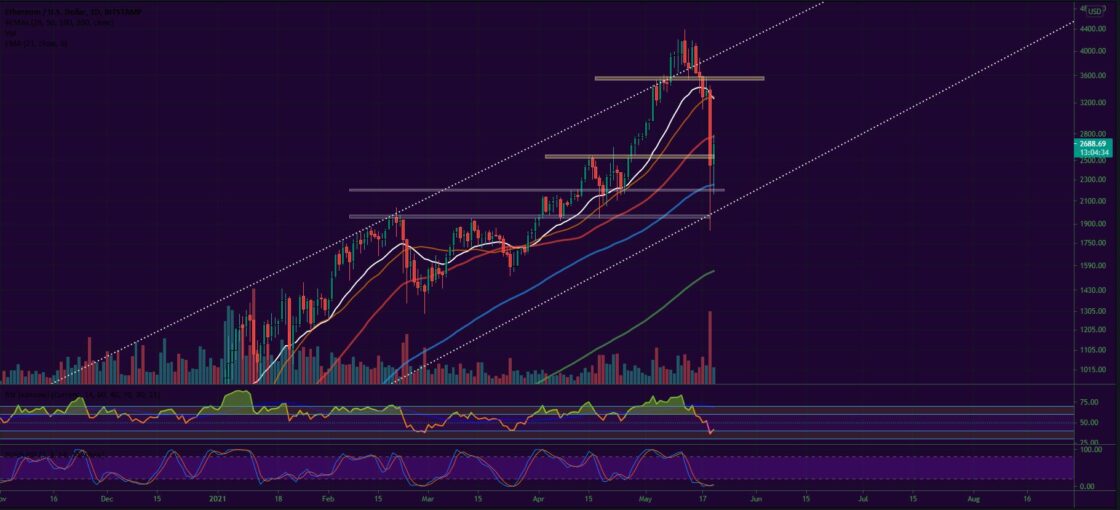
The Ethereum Project token ETH was highly volatile on the last day of the previous week. It was moving up and down the zone between $3,860 and $3,340 before closing with a red candle at $3,580 – below the previous uptrend line, but still above the horizontal support.
The ether was 9 percent down for the seven-day period.
On Monday, the coin continued to move downwards and erased another 8 percent of its value, lost the 21-day EMA, and reached $3,280.
The overall market decline affected the previously unstoppable ETH bulls and they started losing ground. The mentioned $3,500 support turned into resistance, which is normal given the fact it was only tested once in the current run. The Tuesday session was not that good for buyers as they were rejected at the horizontal level and only managed to form a short green candle to $3,370.
The third day of the workweek came with a flash crash. The ETH/USDT pair dropped as low as $1,845, which corresponded to a 45 percent decline, but recovered in the latter part of the session, eventually closing at $2,455.
The coin is currently trading 8 percent higher after surpassing the $2,500 major horizontal level.


