Bitcoin and Ether Market Update November 25, 2021

Total crypto market cap added $45 billion to its value for the period since Monday and now stands at $2.62 trillion. The top ten coins were mostly in red for the last 24 hours with Solana (SOL) losing 3.8 percent while Binance Coin (BNB) added 7 percent to its valuation At the time of writing bitcoin (BTC) is trading at $57,900. Ether (ETH) is at $4,376.
BTC/USD
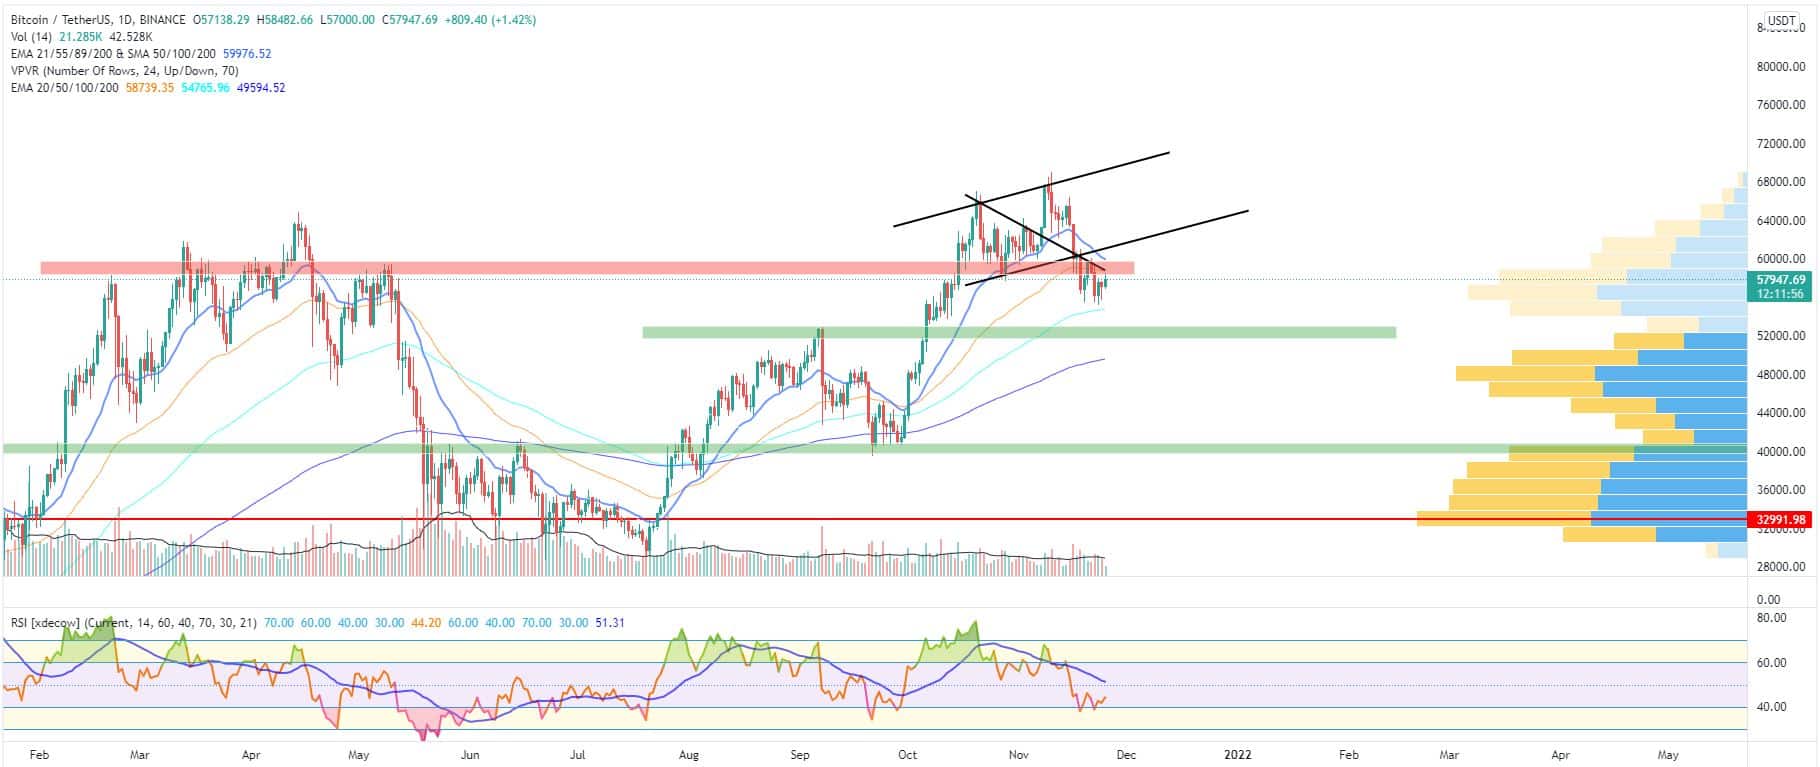
The biggest and most popular cryptocurrency managed to reach the $60,000-mark last Saturday but was rejected there at the meeting point of the former downtrend trendline and the horizontal resistance that was established in the area. It was also close to the most actively traded area as per the Volume Profile indicator (VPVR).
The coin fell down to $58,755 on Sunday and ended the seven-day period with a 10.7 percent loss. Looking at the bigger picture and the weekly chart, bitcoin can keep the bullish structure intact unless it breaks below the $51,500 September high.
The BTC/USDT pair started the new week by making another step down on Monday. It fell below the 50-day EMA on the daily chart and registered a 3.3 percent loss to close the session at $56,250 for the first time since October 10.
On Tuesday, BTC made a new monthly low by hitting $55,200 during intraday but managed to bounce back from that area and form a small green candle to $57,500 as the volumes were starting to increase once again. The recent correction was quite similar to the price action we saw in the 07.09 -21.09 period.
The third day of the workweek came with a drop to $55,800 in the early hours of trading, but buyers were able to partially erase the losses later in the day. Still, the coin closed in red.
What we seeing midday on Thursday is an attempt from BTC to push above the $58,000 mark.

ETH/USD
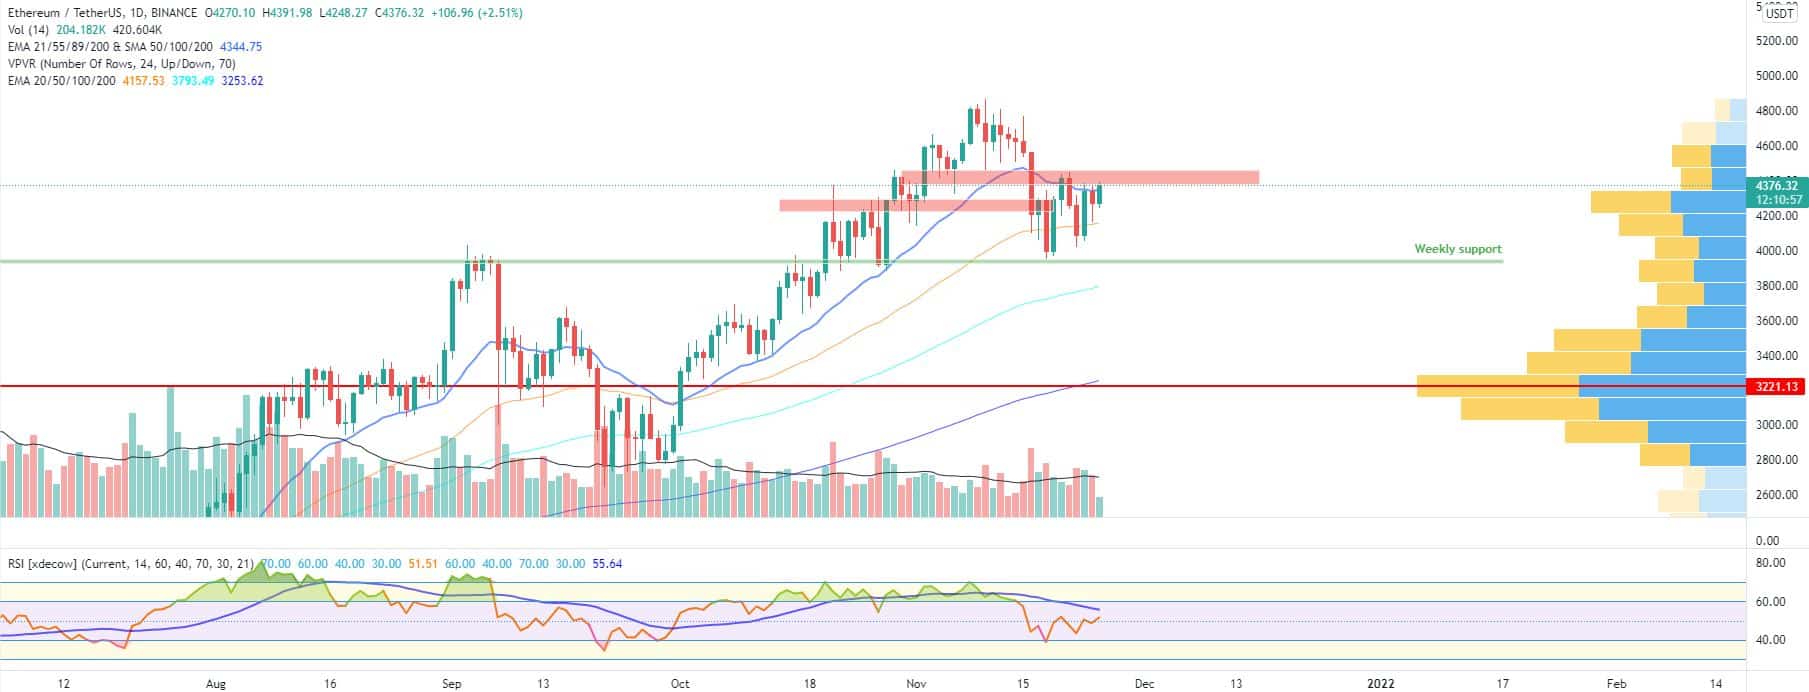
The Ethereum project token ETH closed the trading session on Sunday, November 21 right below the 21-day EMA on the daily chart and near the most actively traded zone according to the VPVR indicator – $4,255. It was 7.7 percent down on a weekly basis but managed to find the needed stability at the $3,950 horizontal support on the weekly timeframe.
The trading volumes remained high and the Relative strength Indicator reached the oversold zone on November, 19.
On Monday, however, the leading altcoin once again moved to the downside in a potential re-test of the mentioned support. This time bears were stopped at $4,024.
The Tuesday session was when the bulls came back strong. They pushed the price up to $4,344 to close the day with a green candle and a 6.1 percent of a price increase.
The mid-week session came with a rejection at the dynamic indicator and a retrace down to $4,271 – an important short-term support/resistance level.
The ether is trading close to $4,400 as of the time of writing.


