Bitcoin and Ether Market Update November 4, 2021

Total crypto market cap added $54 billion to this value for the period since Monday and now stands at $2.71 trillion. The top ten coins showed mixed results for the last 24 hours with Solana (SOL) adding 4.2 percent while Cardano (ADA) registered a 3.9 percent loss. At the time of writing bitcoin (BTC) is trading at $61,615. Ether (ETH) is at $4,520.
BTC/USD
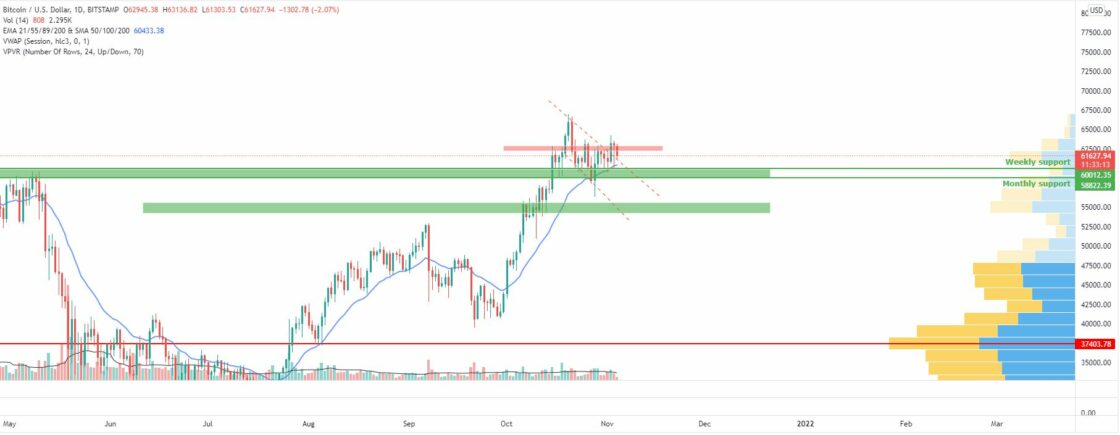
Bitcoin closed the trading day on Sunday, October 31 at $61,340 on its second consecutive day in red. The biggest cryptocurrency was struggling to move above the newly established short-term resistance in the $62,200 – $63,000 area since October 22, but the more bullish among the cryptocurrency traders were pointing to a potential consolidation period. Not only that but the coin was forming a bull flag formation on the daily chart.
It closed the extremely volatile seven-day period with less than 1 percent of the increase. However, the BTC valuation grew by 40 percent for the month of October.
On Monday, the bears pushed the price all the way down to $59,560 during intraday, but the 21-day EMA provided the needed support, so the coin closed with a short red candle at $60,900.
The BTC/USDT pair found its bottom on Tuesday, November 2 when it started moving strongly in the upward direction. The price of BTC broke out of the mentioned bull flag pattern and added 3.9 percent by hitting $63,220. It finally managed to break above the resistance and bulls were now hoping for a proper consolidation at the beginning of the new month.
The mid-week session on Wednesday came with a flash crash. BTC dropped to the 21-day EMA near $60,000, losing 5 percent of its valuation, but quickly recovered eventually ending the day at $63,000 – right above the horizontal line.
What we are seeing midday on Thursday is a significant pullback down to the zone around $61,600 where the upper boundary of the bull flag is situated.

ETH/USD
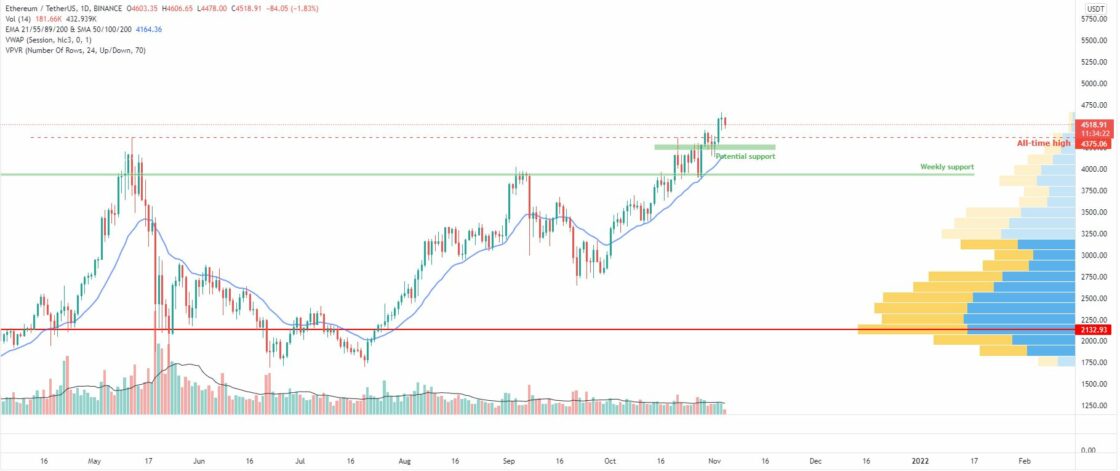
The Ethereum project token ETH registered a new all-time high last week by hitting $4,454 on Friday. Buyers, however, were not able to keep the momentum and the leading altcoin retraced down to $4,296 during the weekend, hitting a four-day low of $4,160.
Still, the ETH/USDT pair registered a 5 percent increase on a weekly basis, confirming the higher high formation on this timeframe. It also jumped by 43 percent for the thirty-day period.
The ether formed a small green candle on the daily chart on the first day of November. According to the latest on-chain statistics, the ETH token has become deflationary for the first time in the history meaning more coins were burned than mined.
This, combined with the even more bullish technical indicators allowed it to continue the uptrend by adding another 6.2 percent on Tuesday, November 2. The move resulted in a new all-time high – $4,600.
The third day of the workweek came with a fresh new record as the biggest altcoin reached $4,651, but remained flat at the daily candle close.
It is currently trading at $4,520.


