Bitcoin and Ether Market Update September 30, 2021

Total crypto market cap lost $59 billion to its value for the period since Monday and now stands at $1.890 trillion. The top ten coins are mostly in red for the last 24 hours with Cardano (ADA) losing 2.7 percent while Binance Coin (BNB) moving up by 1.1 percent. At the time of writing bitcoin (BTC) is trading at $43,067. Ether (ETH) is at $2,963.
BTC/USD
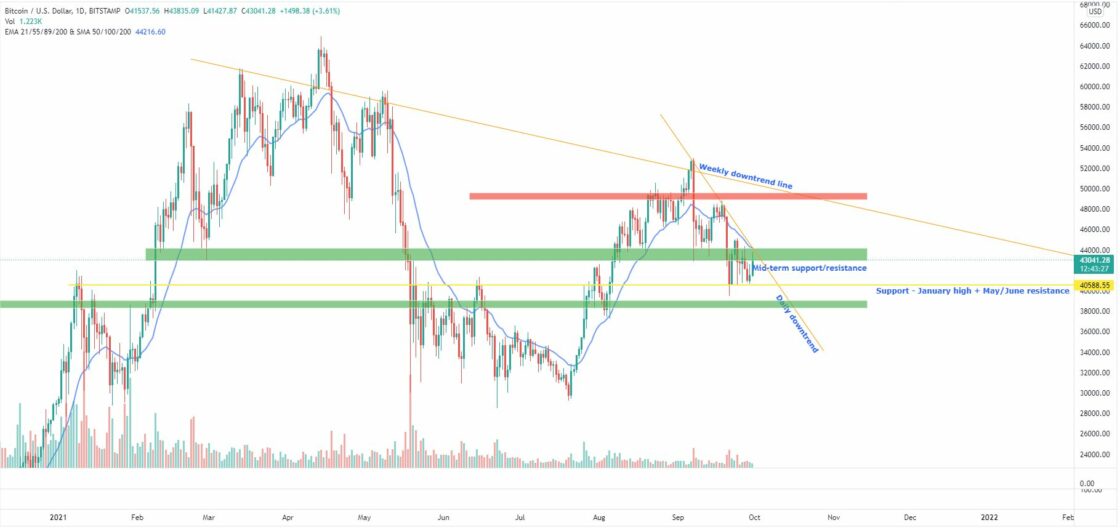
Bitcoin closed the trading session on Sunday, September 26 at $43,158 right below the 21-period Exponential Moving Average (EMA) on the Weekly chart. This dynamic price-movement indicator when crossed down usually tells whether a particular asset has turned from bullish to bearish. However, bitcoin has a long history of not respecting the short-term averages. The coin ended the week with an 8.9 decrease of its valuation, but still in the $43,000 – $44,000 area which is considered a mid-term support/resistance.
On Monday, it climbed up to $44,400 during intraday, but the bullish momentum was not strong enough to support a reversal to the upside. Sellers stepped in and pushed the price down to $42,180 at the daily close.
The Tuesday session was no different and the BTC/USDT pair fell further to $41,100 – touching the January 2021 high, which was also the May/June price resistance line. The level now acts solid support, unbreakable since September 21.
The mid-week session on Wednesday saw BTC jumping to $41,500 as buying volumes increased significantly.
What we are seeing midday on Thursday is the biggest cryptocurrency trading at $42,900 in its second consecutive day in green. The price hit $43,867 earlier in the session, but could not reach the short-term diagonal downtrend line or the 21-day EMA.

ETH/USD
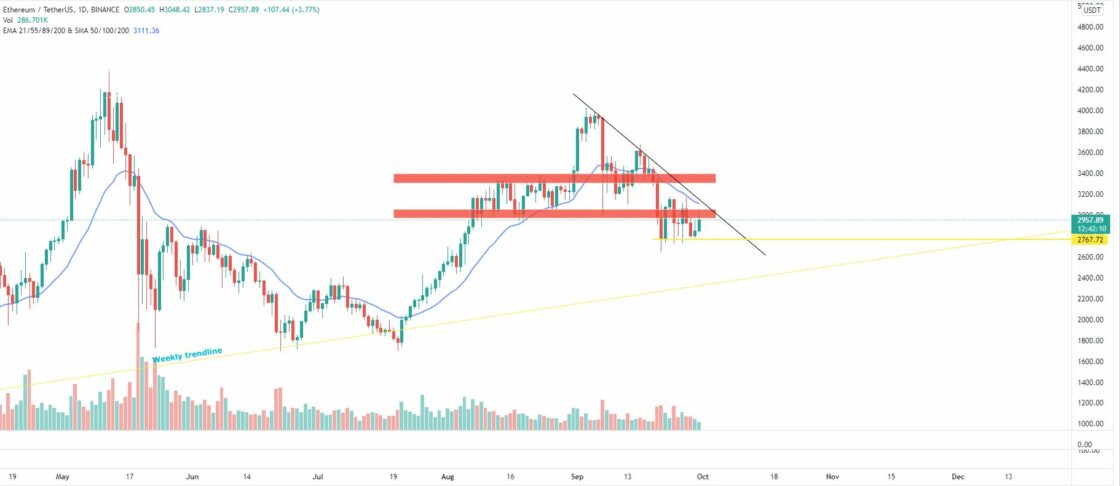
The Ethereum Project token ETH is in a downtrend ever since it hit $4,036 on September 3. The coin formed a solid downtrend channel and by September 26 reached the demand zone located in the $3,000 – $,3100 area. That area provided stability for almost two months.
The ether closed the previous trading week at $3,065, 7,5 percent down on a weekly basis, in its third straight seven-day period in red.
On Monday, the ETH/USDT pair formed the exact same candle but in the opposite direction, completely erasing the gains from the previous day and eventually closing at $2,931.
The second day of the workweek came with a drop below the mentioned demand zone as ETH hit $2,770 for the fifth time in seven days. This mark is now considered short-term support.
On Wednesday, September 29 we saw the leading altcoin rebounding from the mentioned level and forming a short green candle to $2,854 after climbing as high as $2,947 during intraday.
What we are seeing early on Thursday is an attempt from ETH to break back into the old support. It is currently trading at $2,953 as the entire cryptocurrency market is anxiously waiting for the results of Infrastructure Bill voting in Washington later today.


