Analysis: Bitcoin’s Bollinger Bands squeeze hints at bullish breakout


Bitcoin is flashing early signs of a potential breakout as volatility tightens, a pattern often followed by significant price movement.
At press time, Bitcoin (BTC) is trading at $108,494, slightly down 0.3% over the past 24 hours. The price has ranged between $105,430 and $110,307 in the past week and remains just 3% below its all-time high of $111,814, set in late May.
Technical analyst Axel Adler highlighted a key development on a July 8 post on X. The Bollinger Bands on Bitcoin’s daily chart have contracted sharply, with the distance between the upper and lower bands now just 7.7%. This is among the narrowest ranges seen throughout the current bull cycle.
Historically, such squeezes often indicate energy buildup, with breakouts more likely to occur in the direction of the prevailing trend, which in this case, remains upward. According to Adler’s analysis, there have been six notable Bollinger Band squeezes in this cycle.
Price increases immediately followed four of them, while the remaining two experienced short consolidations before starting to rise again. Despite the possibility of a brief pause in momentum, this historical context indicates that the current squeeze may be the beginning of a new leg higher.
Another well-known valuation metric, the Bitcoin Mayer Multiple, is currently trading at 1.1x, which is well within its neutral range of 0.8x to 1.5x. This implies that Bitcoin may still be cheap in relation to earlier bull market peaks and is not overbought by historical standards. In essence, the market appears to be well-positioned for further gains, with valuation metrics offering support.
Market activity has also picked up. Bitcoin’s 24-hour trading volume stands at over $26 billion, up more than 34% from the previous day. In times of tight price consolidation, rising volume is frequently seen as a sign of increased investor interest before a possible move.
On the technical side, the daily chart shows BTC trading comfortably above its 20-day simple moving average, with Bollinger Bands beginning to squeeze tightly. Bitcoin may still rise before reaching overbought territory, according to the RSI, which is currently neutral at 55. While momentum has been flat, the recent uptick in volume and historical context of similar patterns suggest a bullish bias.
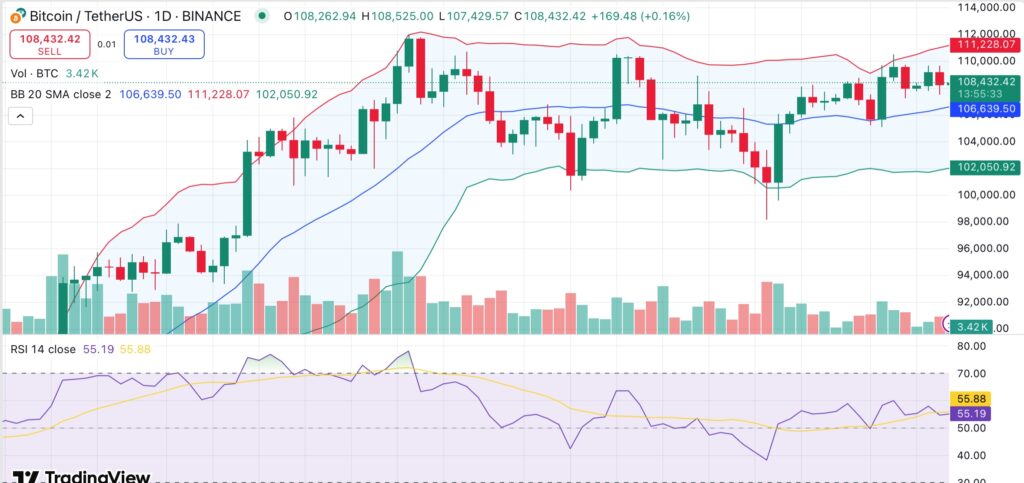
Bitcoin could test and possibly surpass the all-time high of $111,814 if it breaks convincingly above $110,300. If the 20-day moving average around $106,600 is not maintained, a deeper retracement toward $102,000 may be possible. For now, market structure and tightening volatility favor the bulls.