Bitcoin breaks records, but Strategy stock stalls: here’s why


Strategy is forming a bullish setup similar to Bitcoin’s recent breakout. With price testing resistance, a potential pullback to strong support could trigger a move into all-time high territory.
Strategy’s stock (MSTR) is currently trading in a bullish market structure, mirroring the recent price action of Bitcoin (BTC). With a history of aggressive BTC accumulation, MSTR has shown a strong correlation to Bitcoin’s movements, and this correlation may once again lead the stock into new all-time highs. As MSTR tests a key resistance level, the setup suggests either a direct breakout or a bullish correction that sets the stage for another leg up.
Key technical points
- Major Support Zone: $362.50 — confluence of value area low, 21 EMA, and 200 MA
- Market Structure: Higher highs and higher lows since the recent swing low
- Volume Behavior: Declining volume suggests imminent influx following consolidation
- Potential Target: Expansion into ATH price discovery if resistance breaks or holds post-correction
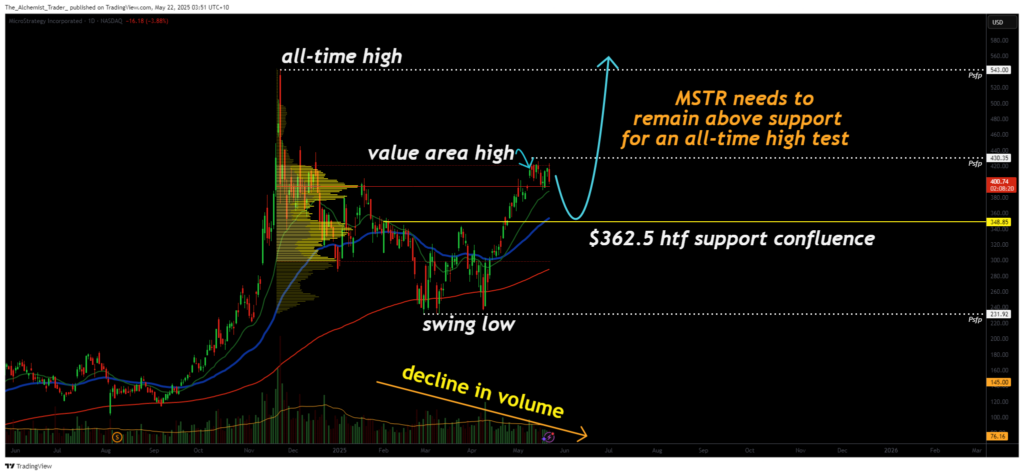
The current price action on MSTR reflects a sustained bullish structure. Since establishing a swing low, the stock has consistently formed higher highs and higher lows, a classic sign of trend continuation. It is now testing a significant resistance zone. If this resistance holds, a short-term correction could follow.
This potential pullback may bring price back to the $362.50 support zone, an area with strong technical confluence. The value area low, 21-day exponential moving average, and 200-day moving average all converge at this level. A correction into this zone would likely establish a higher low and provide the structural base for the next upward move.
Importantly, a breakout above the current high without a correction would also signal strong bullish momentum. It would suggest continued buying pressure and increase the likelihood of price rotation into discovery mode and the formation of new all-time highs, similar to Bitcoin’s recent breakout. MSTR’s historical price action has often mirrored that of Bitcoin, and this technical alignment reinforces the bullish outlook.
What to expect in the coming price action
If MSTR holds above the $362.50 support region or breaks above current resistance directly, the probability of a move into all-time highs increases significantly. Traders should watch for either a structured pullback or a clean breakout, both scenarios support continued upside.