Bitcoin (BTC) and Ethereum (ETH) Market Update November 24, 2022

Total crypto market cap is up by $35 billion for the period since Monday and now stands at $830 billion. The top ten currencies are trading flat for the day with Polygon (MATIC) being the worst performer with 2.5 percent of loses for the last 24 hours. At the time of writing bitcoin (BTC) is trading at $16,546. Ethereum (ETH) is at $1,195.
BTC/USD
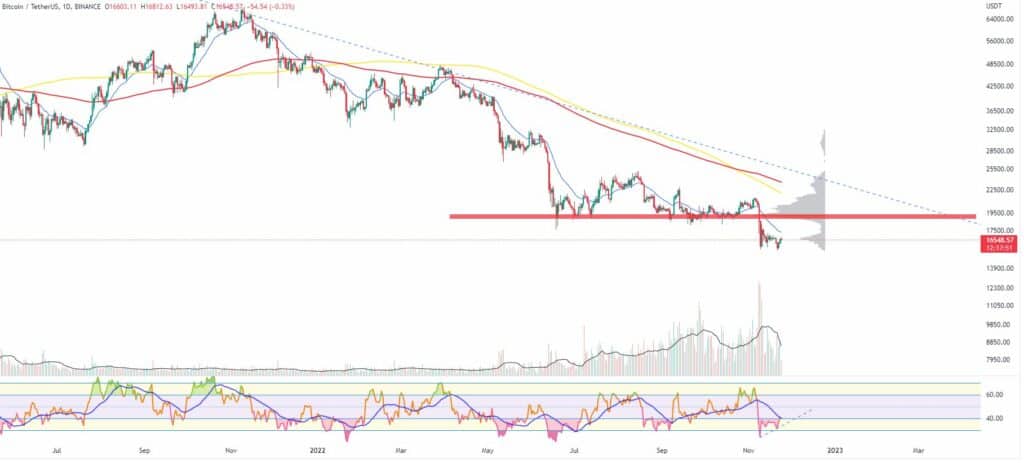
Bitcoin closed the trading day on Sunday, November 20 with a red candle to $16,315 and a 3 percent drop. It also broke the lower boundary of the Bear Pennant figure on the daily timeframe chart suggesting more downside can be in sight.
The coin ended the week of November 14-20 flat after trading in the $15,700 – $17,100 range throughout the period.
The $16,600 level remains a strong short-to-midterm resistance as the most actively traded zone and point of interest for traders.
On Monday, the BTC/USDT pair continued to fall hitting a daily low of $15,488 before closing the session at $15,750, 3 percent down.
It is worth noting that the biggest cryptocurrency found support at the long-term diagonal support line on the 1-Week chart. This line marked the 2018 bear market low and the 2020 COVID low.
The trading day on Tuesday was slightly different. Bitcoin rallied 2.8 percent to hit the $16,200 mark. The trading volumes were well below the average for the last 14 days but the Relative Strength Index (RSI) printed a Bullish divergence on both the daily and weekly timeframes.
This usually hints at a short to midterm change in the trend direction.
The mid-week session on Wednesday came with a second consecutive green candle and a push to the mentioned local resistance at $16,600.
What we are seeing midday on Thursday is a failed attempt to break the horizontal line and a slight retrace. The Bear Pennant figure has been invalidated.

ETH/USD
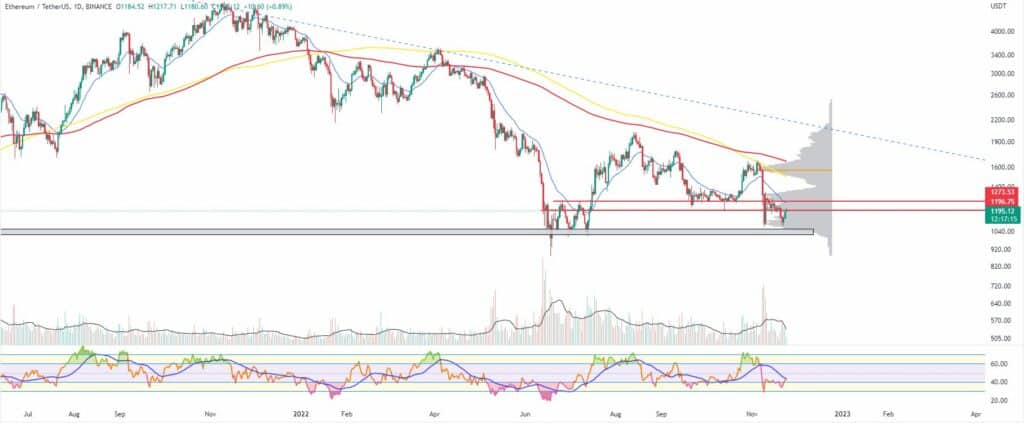
The Ethereum Project token ETH erased 6 percent of its value on Sunday, November 20, and fell all the way down to $1,144 after suffering a rejection at the formed diagonal resistance below the 21-day EMA. It also lost the horizontal support near $1,200. The coin closed the week of November 14-20 with a total of 6.2 percent loss.
On Monday, the ether fell by another 3 percent and touched a 10-day low by re-visiting the $1,100 – $1,000 long-term support line.
The RSI indicator was in a Bullish divergence with the falling asset price while the trading volumes were still low, probably pointing to an exhaustion of the downtrend.
Buyers pushed the price up to $1,140 on Tuesday in the first green day in a while.
Then on the third day of the workweek, the coin extended its gains and managed to reach $1,184 by adding 4 more percent to its valuation.
As of the time of writing this market update, the ETH/USDT pair is struggling to surpass the $1,200 mark, which, as we have discussed previously, has been acting as a price magnet on all timeframes.


