Bitcoin (BTC) and Ethereum (ETH) Market Update September 15, 2022

The total crypto market cap decreased by $82 billion for the period since Monday and now stands at $988 billion. The top ten remained mostly flat for the last 24 hours with Polkadot (DOT) being the worst performed with 1.8 percent loss. At the time of writing bitcoin (BTC) is trading at $20,104. Ether (ETH) is at $1,578.
BTC/USD
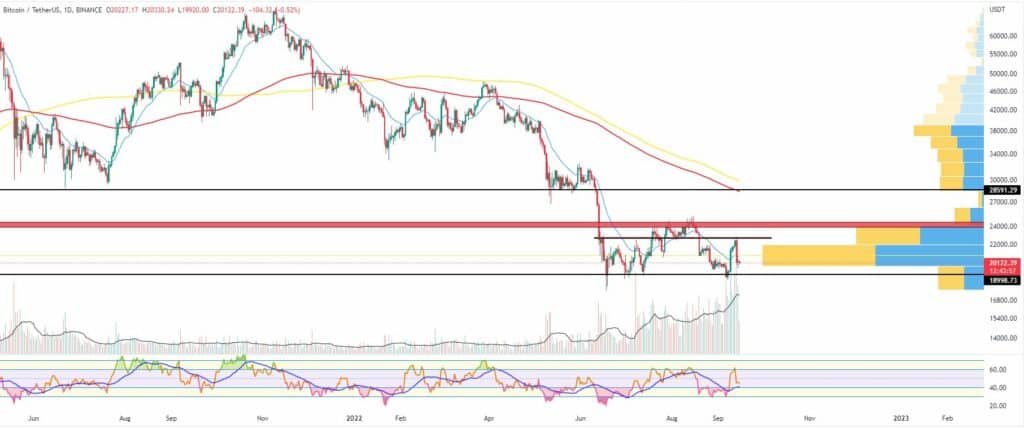
Bitcoin closed the trading day on Sunday, September 11 at $21,828 in its fifth day in green after bouncing back up from the support zone right above $19,000. The coin successfully moved above the 21-day Exponential Moving Average (EMA) on the daily timeframe chart to add 9 percent to its valuation for the seven-day period.
The current technical structure on the weekly chart was looking quite similar to a Double Bottom formation with a neckline at around $24,000. A bullish breakout above that level could suggest a mid to long-term bullish reversal.
On Monday, September 12, the BTC/USDT pair continued to climb and eventually reached the $22,420 mark. The 24-hour trading volumes were significantly higher than the average for the last 14 days.
The bad inflation data from the United States, however, once again spoiled the party. The higher-than-expected numbers pushed the risk assets down and the cryptocurrency market followed.
BTC fell down to $20,160 on Tuesday erasing 10 percent of its market cap during the session.
The mid-week trading on Wednesday came with another volatile day for the market participants. However, the biggest cryptocurrency remained flat. In a scenario where the mentioned macro support around $19,000 fails then the next expected zone of stability is situated near $12,000.
Bitcoin is currently trading at $20,100 midday on Thursday.

ETH/USD
Today the Ethereum followers and the broader crypto community celebrate Merge Day, which saw the biggest altcoin transition from the Proof of Work (PoW) consensus mechanism to Proof of Stake (PoS) in an attempt to improve its overall performance and most importantly – reduce energy consumption. The Merge happened at around 07:30 CET with no immediate price reaction.
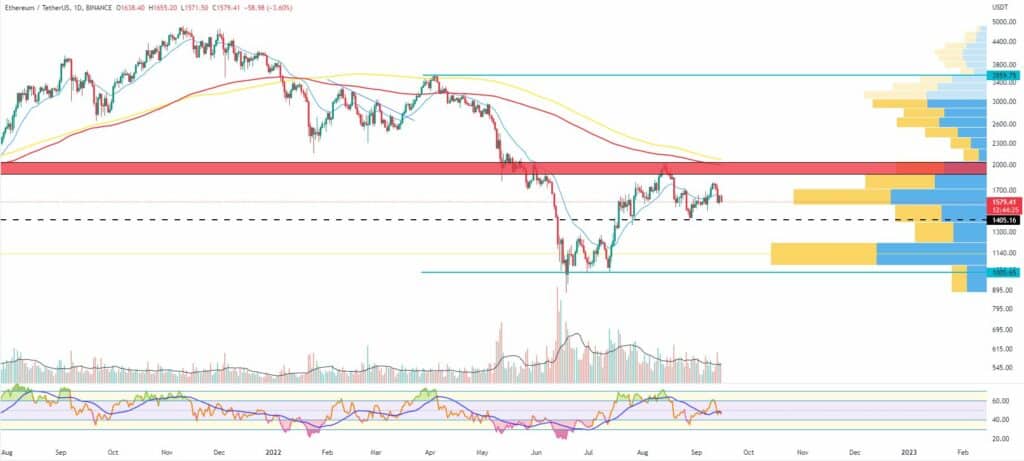
Going slightly back in time, the ether ended the last seven-day period with an 11 percent of increase and above the 200-period EMA on the Weekly chart. The ETH/USDT pair was preparing for the next leg up after a solid consolidation.
On Monday, September 12 it started trading at $1,763 after reaching a high of $1,791 the day before. Bears pushed the price down during the session and the leading altcoin hit $1,717 at the daily candle close.
The Tuesday session was no different and ETH followed bitcoin on its way down as a result of the bad CPI data. The price of the coin decreased by 8.5 percent fully engulfing the last week’s candle. Not only that but we could clearly see a Diamond Top reversal pattern being formed, which is by definition a bearish figure.
On Wednesday, the Ethereum token moved 4 percent up to the 21-day EMA in expectation of the important technical milestone.
As of the time of writing the price is hovering around the $1,600 mark.


