Bitcoin (BTC), Ethereum (ETH), Major Altcoins – Weekly Market Update December 12, 2022

The cryptocurrency market erased $24 billion from its market cap during the last seven days and now stands at $843 billion. The top 10 coins were all in red for the same period with Dogecoin (DOGE) being the worst performer with 8.1 percent of losses respectively. Bitcoin (BTC) is currently trading at $16,977 while Ethereum (ETH) is at 1,251.
BTC/USD
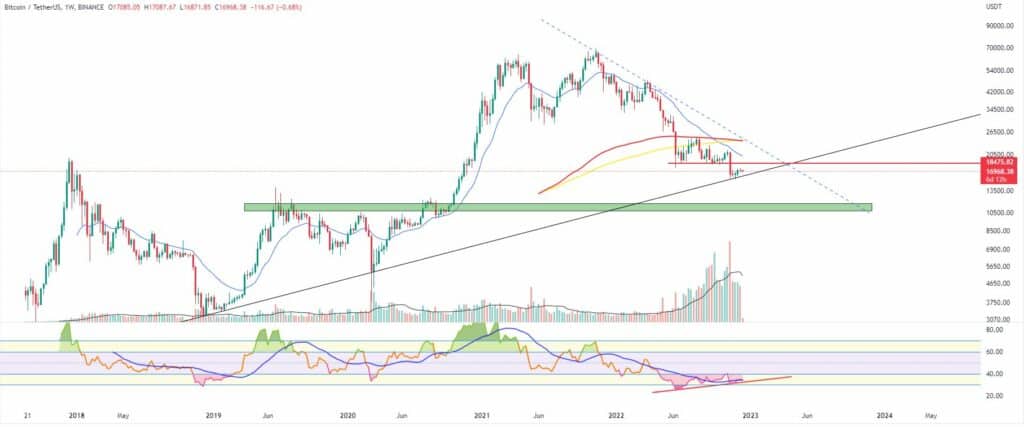
Bitcoin closed the trading day on Sunday, December 4 at $17,114, turning green. The coin ended the week of November 28- December 4 with a 4 percent price increase. It was the second consecutive week in an uptrend after BTC found a local bottom at the long-term diagonal support near $15,600.
The new seven-day period started with an early push from bulls to $17,400. The move, however, was fully retraced later in the day and the coin stopped at $16,950.
It was more than clear that the BTC/USDT pair was now trading in a narrow range between $16,900 and $17,200 with the 21-day EMA in the middle of the trading area.
On Tuesday, the biggest cryptocurrency moved up to $17,080 but it was again unable to make a significant break in either direction. The market participants are cautious at the end of the year and so close to the next CPI data and the Federal Reserve rates decision announcements next week.
The mid-week session on Wednesday came with a drop to $16,670 in the first part of the trading day. Bulls managed to partially erase the losses, but BTC still closed in red at $16,830.
Looking at the weekly chart it is quite possible that we are seeing a bear flag pattern being built there, especially if the mentioned economic data turns out to be better than expected. That can push the price to $18,500 before reversing to the downside again.
On Thursday the session was flat initially but then a rapid increase in the price of BTC allowed it to close at the top of the range.
The trading on Friday was not that exciting either as no general trend could be established.
The weekend of December 10-11 was marked by low volatility and little to no trading opportunities even on the smallest timeframes.
What we are seeing midday on Monday December 12 is a slight decrease in the price of the BTC/USDT pair to the zone below $17,000.

ETH/USD
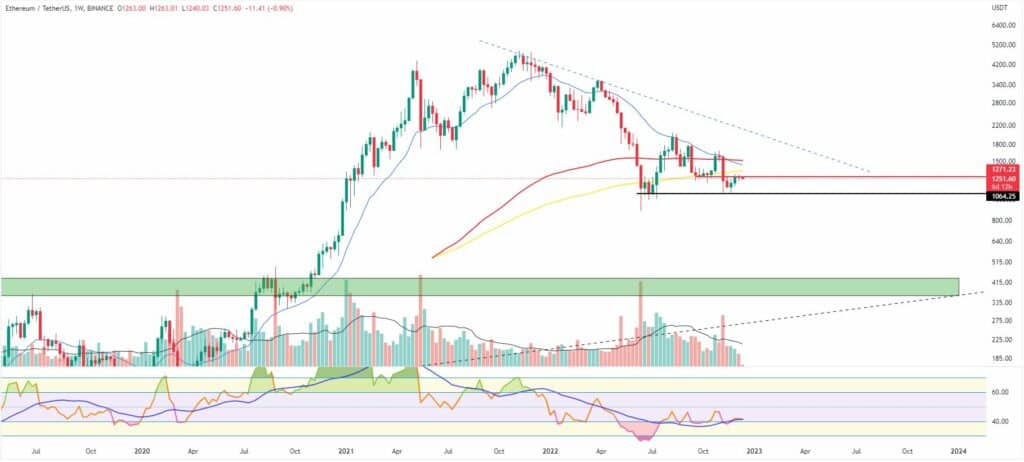
The Ethereum Project token ETH ended the week of November 28- December 4 with a solid 7 percent increase to find itself at the first major resistance on the chart – the previous support zone of $1,270-$1,300.
On Monday, December 5 the ether managed to break above $1,300 in the early hours of trading but bears were quick to react and defended their territory. The coin closed the day at $1,260, below the horizontal resistance but still above the short-term EMA.
The Tuesday session was not that different as the ETH/USDT pair continued to be trading within the range from the previous day.
Then on the third day of the workweek, it was hard rejected at $1,300 which resulted in a reversal to the downside and a 3 percent price correction down to $1,230.
On Thursday, December 8, the leading altcoin made a sharp 4 percent jump reaching the $1,280 mark and fully erasing the losses from the last session.
Buyers were hoping for a solid weekly candle close above $1,300 while bears needed the price below $1,200 and a proper consolidation there.
The ether fell to $1,263 on Friday and hit the 21-day EMA, but continued to be rangebound.
On the first day of the weekend, it became almost static with no trading volumes to support a move in any direction. We saw the exact same picture on Sunday as the market participants were not willing to gamble before the economic data is out next week.
As of the time of writing this market update, ETH is trading at $1,249.

Leading Majors
- Binance Coin (BNB)
All the major altcoins continue to underperform, but BNB is the most stable among them. The relatively good shape of the Binance exchange keeps the price of its native token floating above the major support levels.
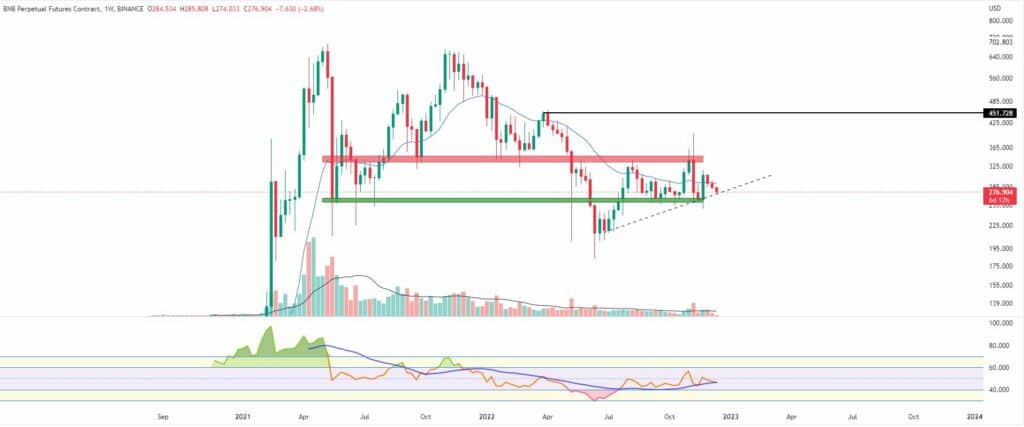
Looking at the 1-Week chart, the BNB/USDT pair is trading above the $260 line since July 2022 when it last managed to break it. The $330 mark remains the next major resistance with the short-term EMA at the midpoint.
Breaking the range to the upside will allow bulls to aim for the next high on the chart – $450.
Down, we see $210 as stable support.
The trading volumes are low, but the RSI indicator has been building bullish momentum ever since the current range was formed.

Altcoin of the week
Our Altcoin of the week is Stacks (STX). Stacks is an innovative cryptocurrency project that aims to bring smart contracts to the Bitcoin network. By doing that, the Layer 1 protocol it is building enables users to fully unlock DeFi, NFT, and all other well-known use cases on the biggest crypto network.
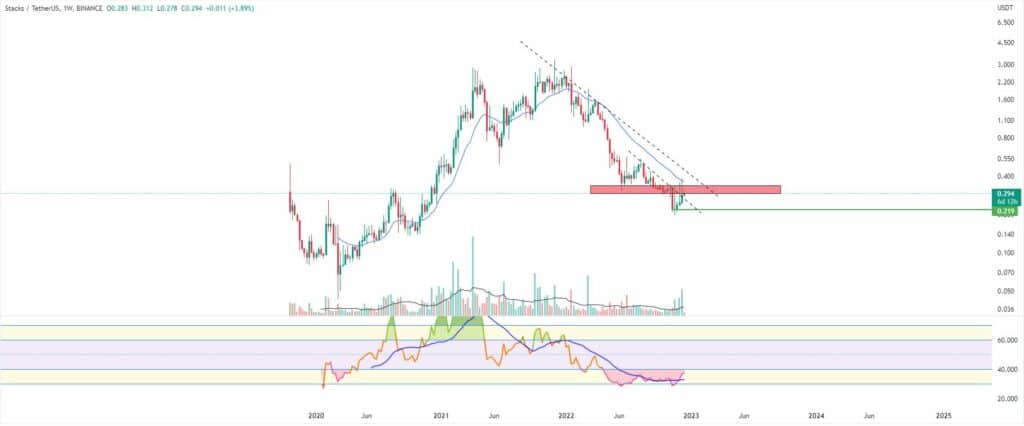
Stacks was the best-performing digital asset on CoinGecko’s top 100 list last week. It managed to add 14 percent to its valuation and was trading 51 percent higher at some point during the seven-day period. Bulls were rejected at the 21-period EMA on the weekly timeframe chart where the next major horizontal resistance area is situated ($0.30-$0.40), but successfully formed a fourth consecutive green candle.
The STX/USDT pair recently broke above the mid-term diagonal resistance line but it is still in a long-term downtrend.
The reason behind the surge in the price of the altcoin is not clear, but it could be related to the huge development progress and the lost trust in the existing Layer 1 protocols.
STX is currently ranked at #88 with a market cap of approximately $405 million.


