Bitcoin (BTC), Ethereum (ETH), Major Altcoins – Weekly Market Update November 21, 2022

The cryptocurrency market lost $41 billion from its market cap during the last seven days and now stands at $797 billion. The top 10 coins were all in red for the same period with Dogecoin (DOGE) and Polygon (MATIC) being the worst performers with 11.2 and 10.5 percent of losses respectively. Bitcoin (BTC) is currently trading at $16,030 while ether is at 1,118.
BTC/USD
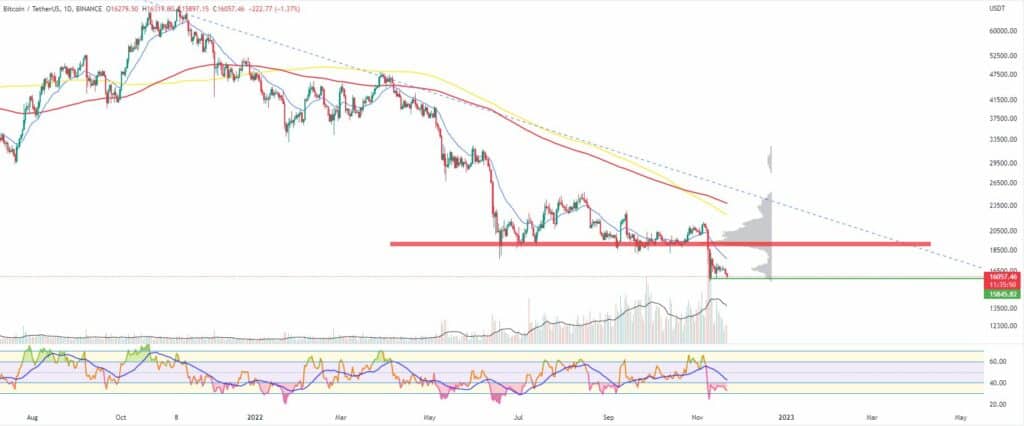
Bitcoin closed the trading day on Sunday, November 13 at $16,347 after losing 3 percent during the session. The biggest cryptocurrency ended the week of November 7-13 with a stunning 22 percent loss in the aftermath of the FTX insolvency fiasco.
On Monday, the price was extremely volatile moving in the $15,800-$17,200 range but still managed to start the new trading period with a green candle that brought a 1.8 percent of increase. The $16,300 area has been established as short-term support on the lower timeframe charts.
The BTC/USDT pair moved further up on Tuesday and hit the $17,000 mark before closing at $16,900. The 24-hour trading volumes for the last week dropped below the average values for the last 14 days while the Relative Strength Indicator (RSI) remained oversold on the 1D chart.
The mid-week session on Wednesday came with a drop to $14,680 on the news that the popular institutional crypto lender Genesis Global was temporarily suspending withdrawals and new loan issuance due to the worsening market conditions.
BTC was starting to form a Bearish Pennant figure on the daily chart, which usually suggests a further downside can be expected. Still, many analysts were pointing to the fact the selling pressure was getting weaker and weaker and the bottom could already be in sight.
On Thursday, November 17, the BTC/USDT pair dropped to $16,384 in the morning, but recovered in the afternoon and closed almost flat for the day.
The overall trading activity and the market volatility were low on Friday and even though bulls made an attempt to push the price out of the mentioned figure, it was not successful and BTC closed flat.
The weekend of November 19-20 started with yet another calm session on Saturday as the leading cryptocurrency continued to trade near $16,700.
Then on Sunday, bears finally took over control and we saw a 2.4 percent decrease in the price thus breaking the lower boundary of the Bearish Pennant.
What we are seeing midday on Monday is a continuation of the downtrend.

ETH/USD
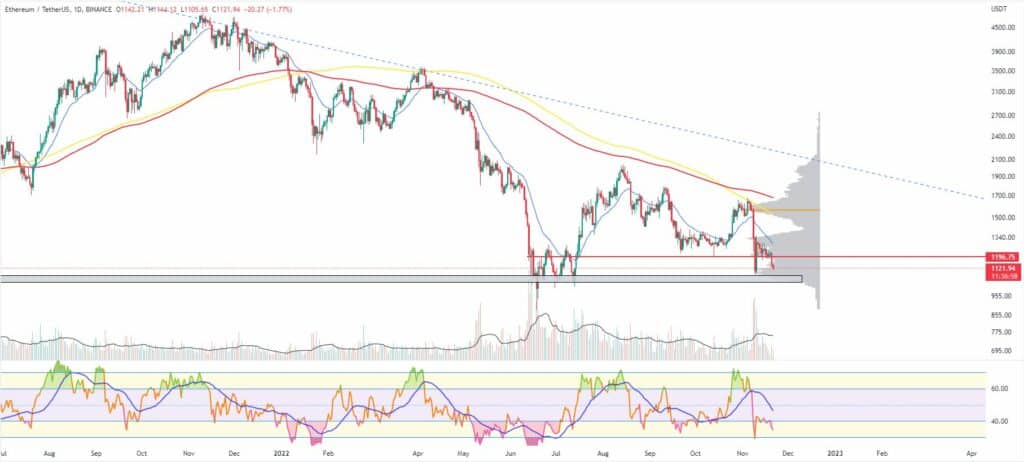
The Ethereum Project token ETH fell to $1,222 on Sunday, November 13, and ended the previous seven-day period 22 percent lower, clearly rejected at the 21-period EMA on the weekly timeframe chart.
On Monday, the ether briefly touched $1,293 but then went back below $1,270 which we considered the current local resistance with $1,200 being the support. Still, it managed to form a green candle on the 1D chart.
The Tuesday session was no different and bulls once again tried to break above the horizontal resistance and once again failed.
The ETH/USDT pair was seeing very low 24-hour volumes with an RSI in the mid-zone.
On Wednesday, it tested the lower boundary of the improvised range and ended the day with a 3 percent loss, but still without any major change in the trading direction.
Bears pushed the price down to a new local weekly low and temporarily below the $1,200 support line on Thursday before it partially recovered in the evening.
The Friday session came with a small green candle and less than a percent of a jump from the horizontal line on the 1D chart. This price action was continued on the first day of the weekend when ETH reached $1,220, hitting a daily high of $1,235.
On Sunday, it fell 6 percent down to $1,143 looking to soon re-test the $1,100 – $1,000 major multi-timeframe support zone.
As of the time of writing this market update the ether is trading slightly lower.

Leading Majors
- Litecoin (LTC)
Litecoin is one of the oldest cryptocurrency protocols out there and is usually performing well during turbulent times thanks to its solid community and long history.
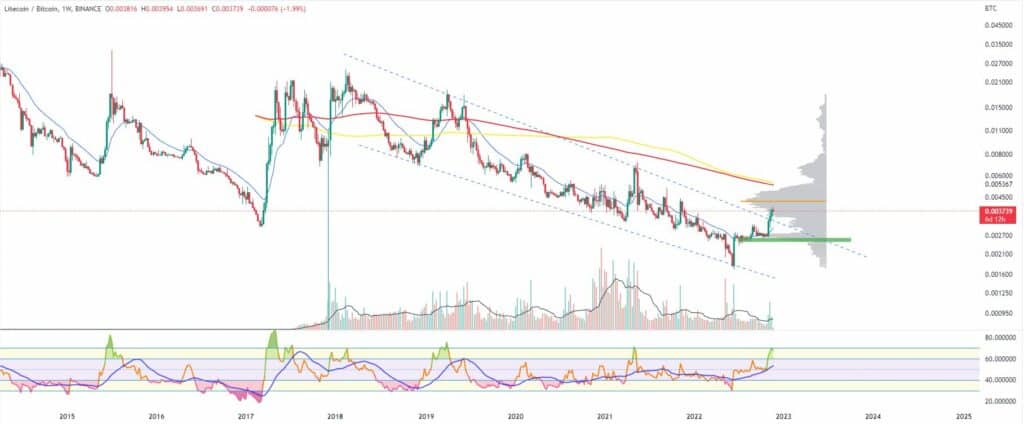
Last week it was one of the few digital assets to trade in green thanks to its good performance against BTC on the LTC/BTC pair.
The coin successfully added 11 percent making it a total of 42 percent increase since the beginning of the month. It broke out of an almost 5-year-long downtrend channel and managed to surpass the 21-period EMA on the 1-week chart.
On the LTC/USDT pair, we still see the zone around $65 and the former range high as the next major resistance while the psychological level of $50 should be able to provide the needed support.
On the daily timeframe chart the price is hovering between the 200- and 21-day EMAs and struggling to make a significant direction change by breaking above the horizontal resistance.
Below is the LTC/BTC chart.

Altcoin of the week
Our Altcoin of the week is The Open Network (TON). TON is a decentralized layer-1 blockchain that was initially developed by the social media platform Telegram before they were forced to abandon it by the US SEC. Now it is mainly being driven by the open community, still closely related to the Telegram app team though.
Last month, Telegram officially unveiled its new marketplace called Fragment.com enabling users to buy and sell platform usernames using the TON coin. Additionally, we saw new developments in the Tonhub wallet and integration with SafePal wallet while DWF Labs announced they will invest $10M in the TON ecosystem.
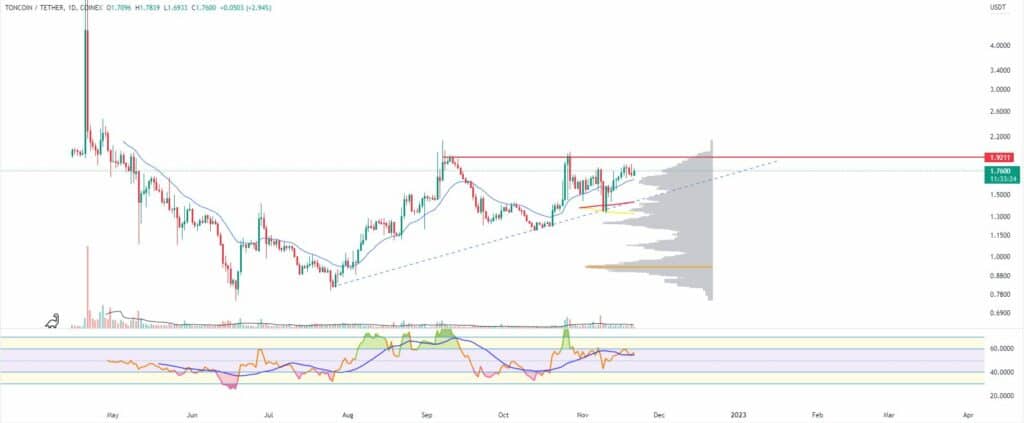
The TONUSDT pair added 2.7 percent to its valuation for the last seven days and is now trading at $1.75 – 134 percent above its all-time low and close to the September 2022 highs. It is now situated above the 21-period EMA on the weekly timeframe chart.
Bulls will be looking at $1.9 as the next big resistance above.
The Ton project is currently ranked at #26 on CoinGecko with a total market cap of approximately $2.5 billion.


