Bitcoin (BTC), Ethereum (ETH), Major Altcoins – Weekly Market Update October 24, 2022

The cryptocurrency market lost $10 billion from its market cap during the last seven days and now stands at $928 billion. The top 10 coins had mixed results for the same time period with ether (ETH) adding 2.8 percent while Solana (SOL) and XRP (XRP) lost 4.5 and 4.4 percent from their respective values. Bitcoin (BTC) is currently trading at $19,377 while ether is at 1,346.
BTC/USD
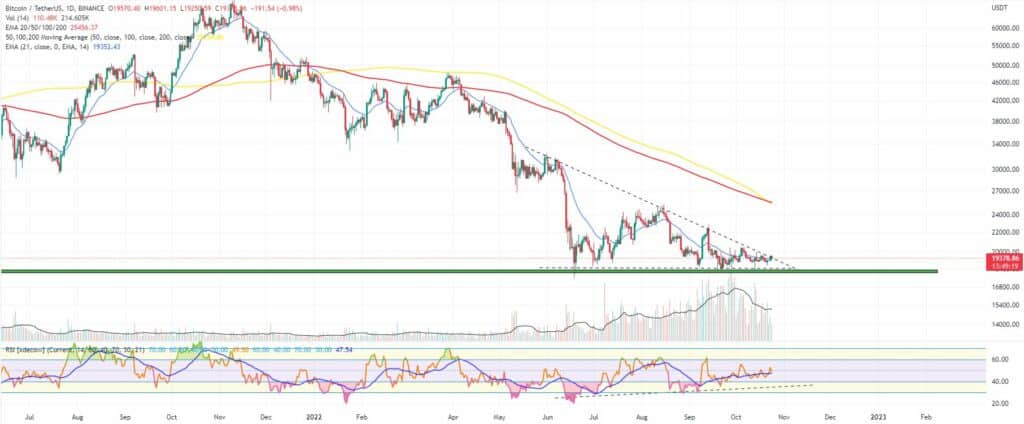
Bitcoin closed the trading day on Sunday, October 16 at $19,250 forming a new local horizontal support around the $19,000 mark. Bears haven’t been able to push the price for a candle close on the daily chart below that price level since September 27.
The biggest cryptocurrency closed the previous seven-day period with a 1 percent loss after trading in the wide range between $18,300 and $20,000.
On Monday, the BTC/USDT pair continued to move in the upward direction with a 1.5 percent increase to $19,500, which could be considered as the top of our improvised short-term range.
The Tuesday session was slightly different as bulls were rejected at the upper end of the mentioned range and the price of BTC was forced to re-test $19,000 once again, eventually stopping at $19,330 at the candle close.
The mid-week trading on Wednesday came with a further decrease down to $19,100 as neither buyers nor sellers were able to take control and choose the market direction.
On Thursday, October 20 we saw an early drop to $18,900, but bulls pushed the price up above the support at the daily candle close. The 24-hour trading volumes remained below the average values for the last 14 days while the Relative Strength Index (RSI) continued to crawl higher towards the overbought zone, suggesting an accumulation in the range might be happening.
Looking at the bigger picture, the price of the biggest cryptocurrency was still caught in a narrowing range, in a Descending triangle formation. A clean break below the baseline would most probably result in a double-digit decline in the coming months. A break to the upside might see BTC re-visit the high of the range near $25,000 where the mid-term diagonal resistance also is.
The Friday session started quite badly for bulls. BTC fell all the way down to $18,664 but somehow managed to recover in the evening and once again kept floating above the support.
The weekend of October 22-23 started with a jump to $19,200 on Saturday followed by a big green candle to $19,600 on Sunday – the zone we consider the current range high, but still – above the 21-day EMA and out of the Descending triangle pattern. A proper confirmation of a break here followed by consolidation will open the door or further move to the upside.
What we are seeing midday on Monday is a price correction down to $19,350.
ETH/USD
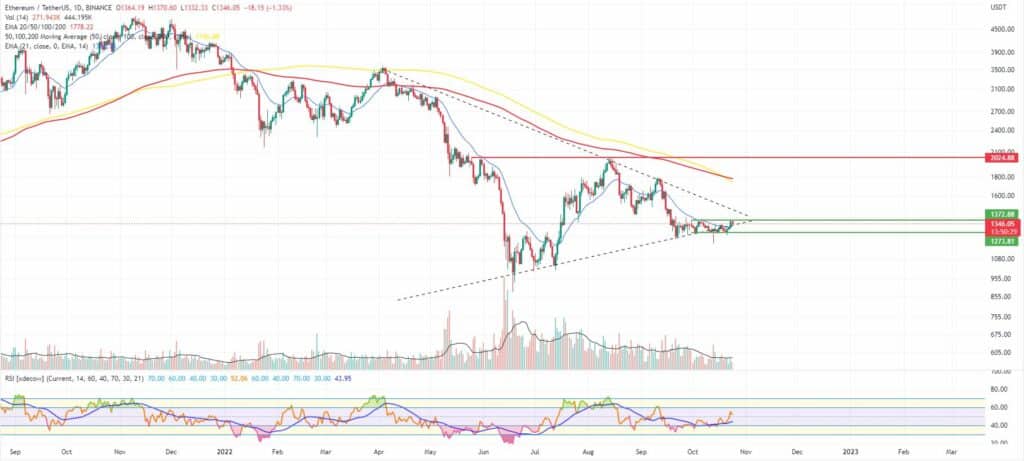
The Ethereum Project token ETH ended the previous trading week with a 1.5 percent loss and above the long-term diagonal uptrend line.
The price, however, has remained locked in the $1,400 – $1,200 range since September 19.
On Monday, October 17, the coin formed its second consecutive green candle on the daily chart and confirmed its presence above the mentioned diagonal.
24-hour trading volumes were getting weaker and weaker on a daily basis.
The Tuesday session saw the price of ether erasing all gains from the previous day and moving close to the mid-point of the range.
Then, during the third day of the week, it fell further down to $1,280 as $1,270 turned into a short-term stability zone.
On Thursday, October 20 the ETH/USDT pair was trading in the $1,260 – $1,310 range, but once again managed to bounce back up from the horizontal support ending the session flat.
As previously discussed, as long as the price of the leading altcoin remains below the 21-day EMA there is a high risk of further selloff down to the next major support zone near $1,000.
The Friday session was slightly different as bulls finally came to the party. The ether hit a daily low of $1,250 in the morning, but then quickly recovered and ended the session in green at $1,310, engulfing the last red candle and adding 1.5 percent to its valuation.
The first day of the weekend came with an attempt to break above the short-term EMA on the daily timeframe chart and a second consecutive day in green.
Then on Sunday, we saw a 4 percent increase and a solid push from buyers to $1,364 surpassing both the EMA and the previous diagonal support.
The coin, however, faced some resistance right below the range high and pulled back down to $1,340 as of the time of writing this market update on Monday.
Leading Majors
- Aave (AAVE)
One of the biggest lending protocols in crypto, Aave has been busy recently with building the Lens social platform and the GHO stablecoin.
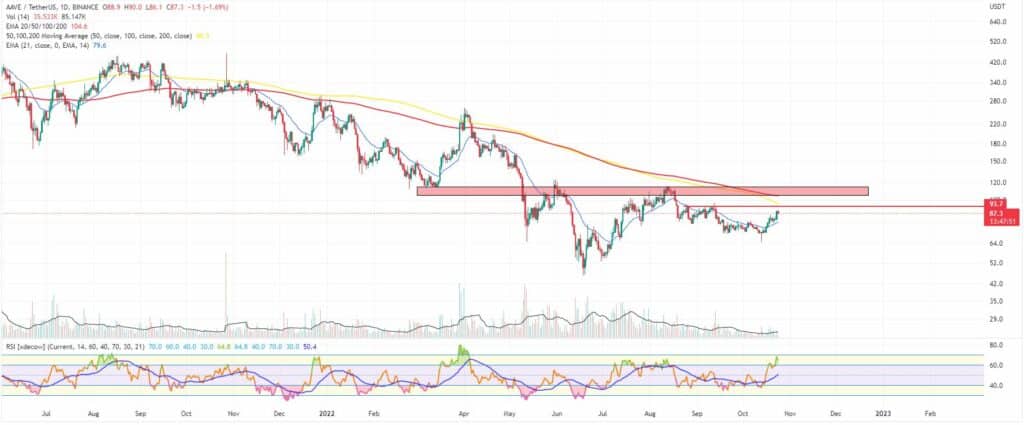
The platform token AAVE jumped by 19 percent during the last week and hit the 21-day EMA in a potential formation that can see it form a new higher high in the coming weeks.
$92 is the closest obstacle in front of bulls as the last range high while the $105-$115 area is the multi-timeframe resistance and the biggest zone of interest on the chart for the last 8 months.
Support at $78-$79.
Altcoin of the week
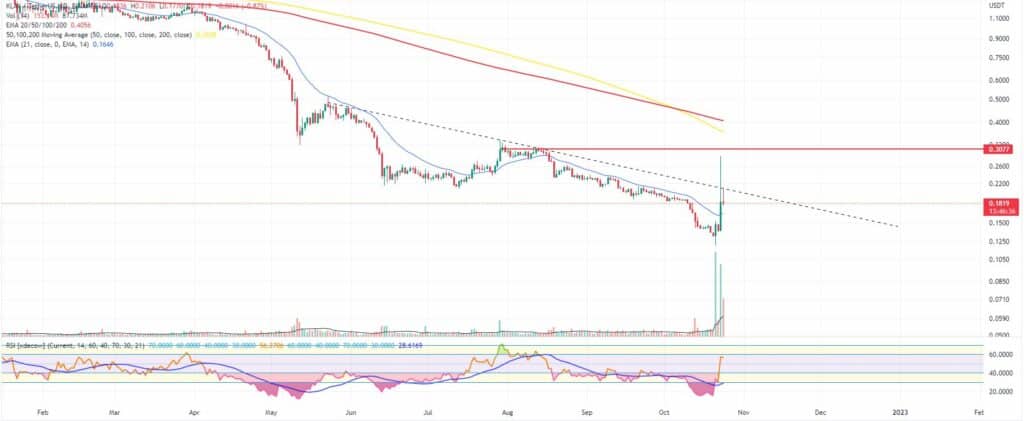
Our Altcoin of the week is Klaytn (KLAY). Klaytn is a layer 1 public blockchain with the main focus on metaverse development and supporting the creator economy in the crypto industry.
The KLAY token was the best-performing asset on the CoinGecko Top 100 list with a 28 percent increase in the last seven days. The coin is now ranked #76 with a market cap of $559 million.
The main reason behind the recent surge in the price of KLAY is the extremely oversold chart as well as the recent Phemex listing and the official proposal to reduce the existing block rewards by ⅓ in order to optimize the level of KLAY emission.
