Bitcoin (BTC), Ethereum (ETH), Major Altcoins – Weekly Market Update October 3, 2022

The cryptocurrency market lost $5 billion from its market cap during the last seven days and now stands at $926 billion. The top 10 coins traded mostly in red for the last seven days with XRP (XRP) and Cardano (ADA) losing 9.9 and 5.6 percent respectively. Bitcoin (BTC) is currently trading at $19,165 while ether (ETH) is at 1,292.
BTC/USD
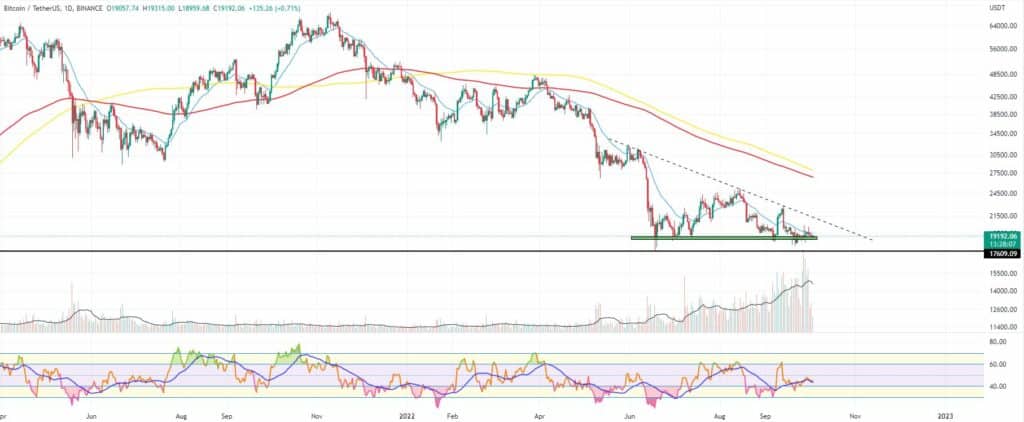
Bitcoin closed the trading day on Sunday, September 25 at $18,842 and after a three-day long selling, it managed to find stability at the good old support area between $18,000-$19,000. It ended the seven-day period with a 3.3 percent decrease.
The biggest cryptocurrency was playing with fire, flirting with support that if broken could drive its price down to $16,000 at least. However, the recent price action could also be interpreted as a deviation below the support and confirmation of the Double Bottom formation on the Weekly timeframe.
On Monday, September 26 the BTC/USDT pair showed some strength and rallied all the way up to $19,260 to add 2 percent to its valuation completely engulfing the last candle.
The Tuesday session was extremely volatile. Buyers pushed the price up to $20,400 in the early hours of trading or 6 percent higher but did not manage to preserve their gains and the coin ended up the day in red.
We saw the exact same volatility but in the opposite direction on Wednesday as it was bears’ turn to be pressured. Bitcoin was trading at $18,470 intra-day, but bulls were in control of this type, dictating the direction. The price stopped at $19,426 or a little more than a percent higher.
On Thursday, the biggest cryptocurrency moved further up to hit the 21-day EMA near $19,600 and closed in green even though it was once again trading lower in the first part of the trading day.
The Friday session saw BTC print the exact same candle but in the opposite direction, erasing the gains from Thursday. The coin was trading as high as $20,200.
The month of September was closed with a 3.3 percent loss.
The weekend of October 2-3 started with a drop to $19,300 on Saturday, which was followed by a third consecutive day in red on Sunday as the price re-visited the $19,000 mark.
What we are seeing midday on Monday is a slight jump to $19,120.

ETH/USD
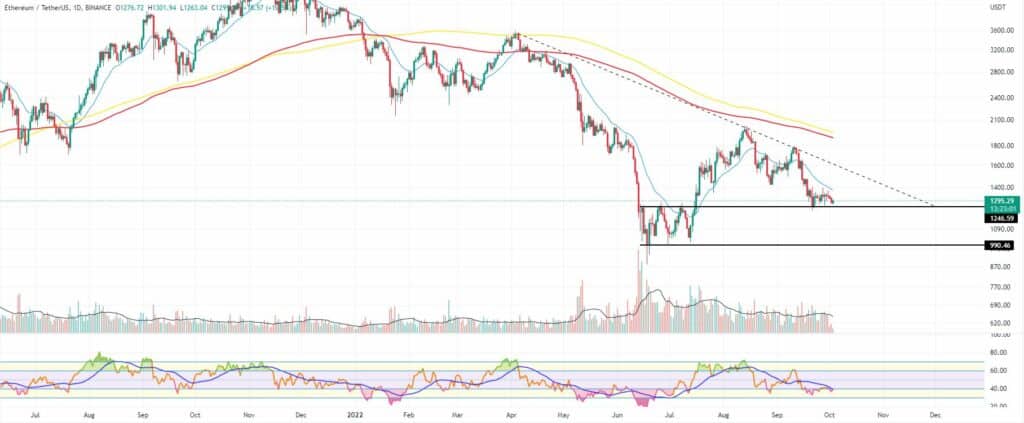
The Ethereum Project token ETH managed to form a new range after breaking below the $1,330 mark. It is currently hovering in the $1,250 – $1,350 zone.
On Monday, September 26, the new seven-day period started with a solid push upwards to $1,340, which saw the last 2 daily timeframe candles being engulfed and 3 percent added back to the ETH market cap.
The ether bulls were strong on Tuesday and the price reached $1,400 intraday, but just like Bitcoin, the coin lost its momentum in the evening and dropped to $1,330 at the end of the session.
The mid-week trading day on Wednesday came with a sudden drop to $1,255 in the morning, triggering long position liquidations across the major exchanges before the price came back up to $1,340 before the daily candle close.
On Thursday, the ETH/USDT pair remained flat, still unable to break out of the mentioned range even though it was volatile and was moving up and down the $1,290 – $1,350 range during intraday. The upper boundary of the range was tested too many times without cracking.
The last day of the workweek found ETH temporarily trading at $1,374 before eventually closing in red. The main reason for the overall bearish sentiment was the SPX index broke its horizontal support thus invalidating (for now) the Double Bottom scenario. A Bearish Wedge pattern was spotted on the 1D chart.
ETH ended the month of September with a 14 percent loss.
The first day of the weekend came with a drop to $1,311, which was followed by another one – this time to $1,276 on Sunday.
As of the time of writing, the ether is trading in green, at $1,292.

Leading Majors
- Binance Coin (BNB)
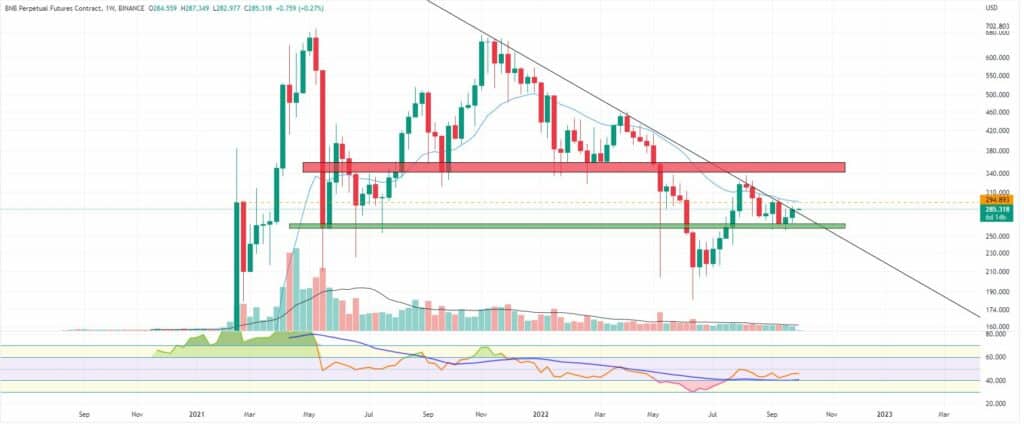
The biggest and most popular exchange token continues to be relatively stable compared to the rest of the Top 10 coins.
Moreover, the technical analysis of both the daily and weekly timeframes favors a potential uptrend continuation.
The BNB/USDT pair closed the previous seven-day period at the mid-term diagonal resistance on the 1W chart and a breakout confirmation this week, combined with the fact it bounced back perfectly from the $260 support and completed a Bull Flag consolidation, might result in a 20 percent jump to the next resistance area.
This of course is if BTC and the overall market condition do not worsen and support a broader market relief rally instead. Additionally, the zone right below $300 is where the 21-period EMA and the last lower high sits, which can easily turn out to be a rejection area for bulls.

Altcoin of the week
Our Altcoin of the week is Reserve Rights (RSR). This cryptocurrency project is aimed at building an ecosystem that facilitates the creation and use of asset-backed currencies and stable currencies. In such turbulent times of high inflation worldwide, a stable solution is in high demand which explains the recent jump in the price of the RSR token.
Not only that but the official RSR protocol launch is scheduled for October 10 adding to the bull case for this coin.
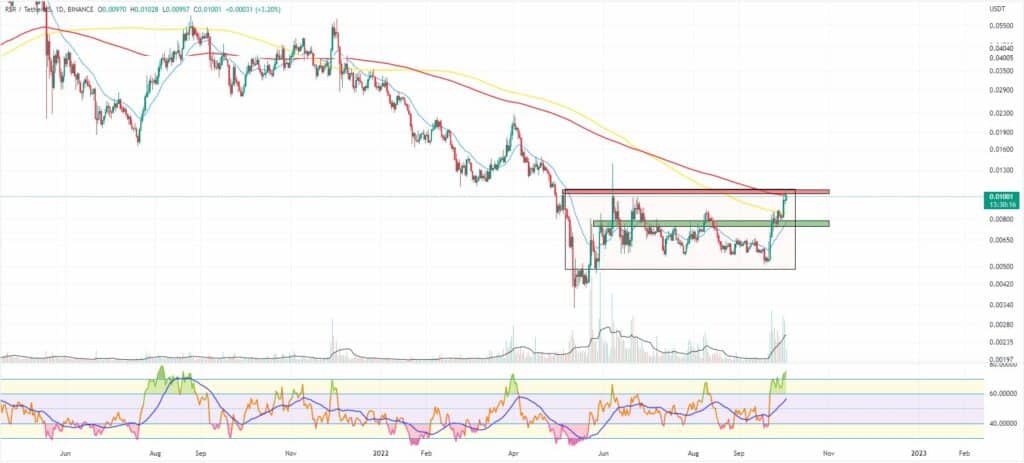
The RSR/USDT pair added 23.7 percent to its valuation for the last seven days making it a total of 193 percent since hitting an all-time low in early May 2022.
Even though it moved above the 21-period EMA on the weekly chart and is trading at $0.0098 right now, we are still not seeing a clear break out of the range as the $0.1 mark remains the range high on both daily and weekly timeframes.
Support right in the sub-$0.008 area.
The Reserve Rights protocol is currently ranked at #93 on CoinGecko with a total market cap of approximately $418 million.


