Bitcoin bulls are ignoring these three red flags: is a drop to $100,000 likely this week?


Bitcoin slipped under key support at $108,000, gathering liquidity below the $107,000 level on Thursday. The largest cryptocurrency’s holders appear unimpressed by promises from regulators and bullish commentary from U.S. Vice President JD Vance and Senator Cynthia Lummis. BTC could sweep liquidity under the $100,000 milestone this week or over the weekend, analysts warn.
Table of Contents
Bitcoin bulls are slowing down, what’s next
Bitcoin’s (BTC) maximalists and permabulls are showing signs of slowing down, with Strategy’s purchases declining in volume. Between May 19 and May 25, Strategy acquired 4,020 BTC at $40.61 billion, using proceeds from “Common ATM, STRK ATM and STRF ATM,” according to the firm’s May 26 filing.
Barron’s reported a correlation between Strategy’s Bitcoin purchases and BTC price. While some analysts argue the company’s large acquisitions have positively influenced BTC, TD Cowen examined six months of price action and trading volume and concluded that “MicroStrategy’s purchases represented only a fraction of total Bitcoin trading volume, with a median average weekly result of 3.3%.”
The correlation is insignificant, therefore Bitcoin’s price trend is unaffected by Strategy’s purchases.
News of Wall Street giants and firms adding Bitcoin to their treasuries may have lifted sentiment among traders. However, there is no clear evidence of meaningful impact, and this week, traders remain largely unmoved by both promises and purchases.
Institutional capital flow into U.S.-based spot Bitcoin ETFs is also declining, while large whales and long-term BTC holders are realizing profits on their positions.

Since April 1, three key segments of Bitcoin holders have shown similar behavior. Addresses holding 10–100 BTC, 1,000–10,000 BTC, and 100,000–1 million BTC have all reduced their holdings, likely cashing out gains from the April to May rally.
Santiment data shows a steep decline in holdings of the three cohorts.
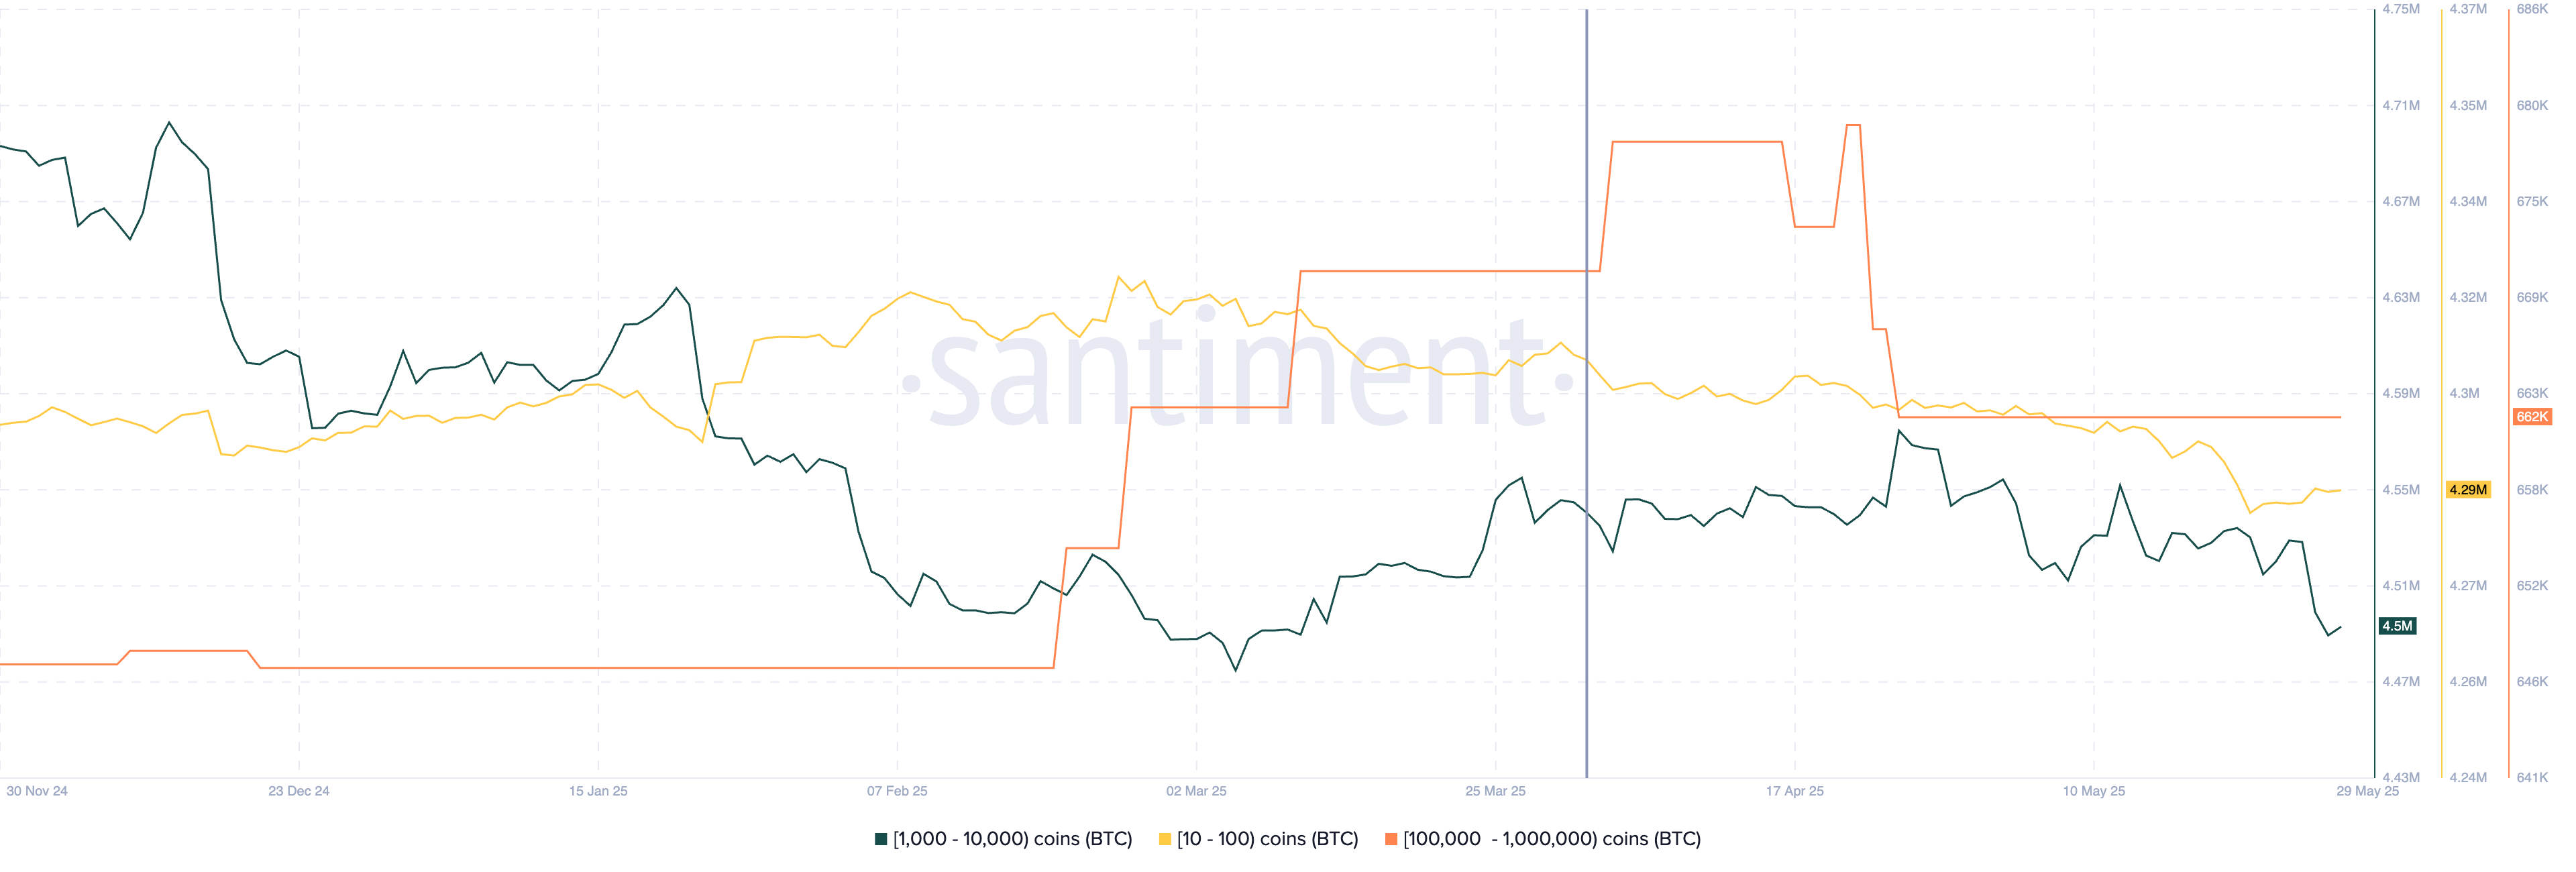
If this profit-taking continues, it could increase selling pressure across exchanges and push BTC lower in the long term.
Bitcoin price forecast
Bitcoin is currently trading under the $108,000 support level, at $106,286 at the time of writing. On the daily timeframe, technical indicators support a bearish outlook. The RSI is trending downward at 56, while the MACD is printing red histogram bars below the neutral line, both signs of weakening momentum.
BTC could collect liquidity at support levels S1 and S2, marking the upper and lower boundaries of the FVG on the daily chart, located at $102,315 and $97,732, respectively. A retest of the $100,000 psychological milestone remains a likely scenario.
Bitcoin is currently less than 4% away from its S1 support. Once the FVG is filled, a recovery may begin, as this zone is marked as a bullish FVG on the BTC/USDT daily chart.
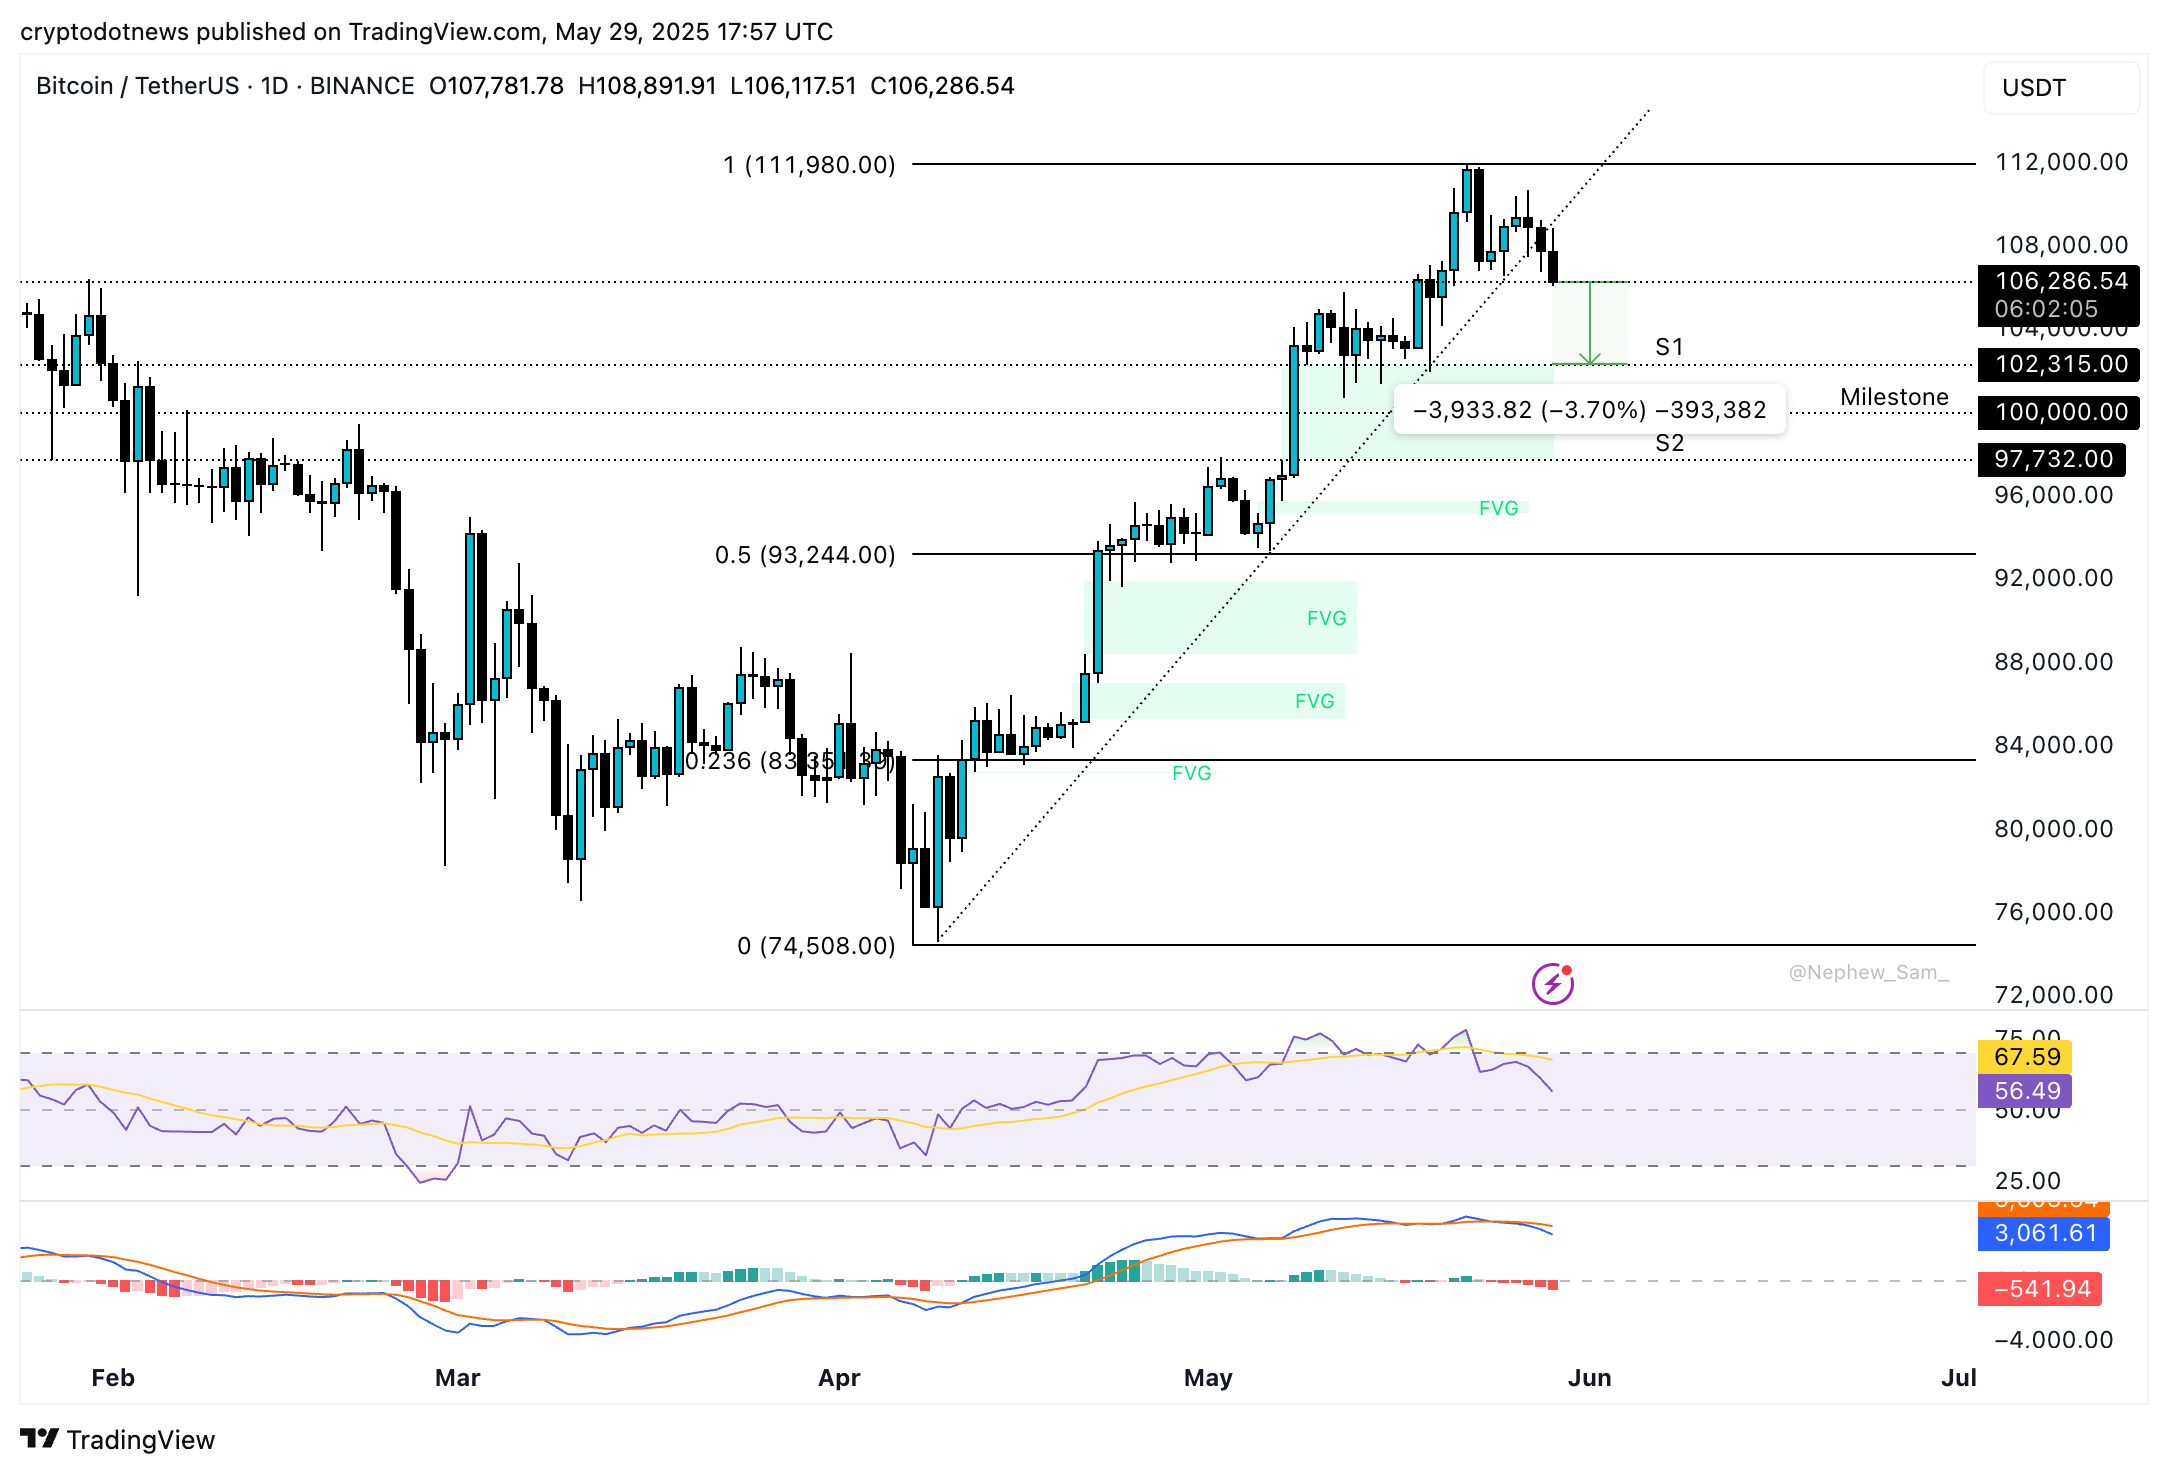
Alternatively, a daily close above $108,000 could invalidate the bearish structure and open the door for a retest of the all-time high at $111,980.
Capital rotation is real though altcoin season is delayed
The team of analysts at Bitunix told Crypto.news in an exclusive interview that capital rotation favors altcoins in certain segments this cycle, rather than a full-blow alt season as observed during 2018 and 2020 bull runs.
As Bitcoin’s market dominance weakens, analysts suggest BTC may have peaked. Despite institutional inflows, several altcoin sectors have shown relatively stronger performance.
Bitunix analysts said:
“We’ve observed accelerating volume and capital inflows into narrative-driven tokens in sectors like AI (e.g., FET, RNDR), real-world assets (e.g., ONDO, LINK), and Layer 2 (e.g., ARB, OP).
If BTC faces resistance in the 110k–115k range and ETH breaks through the critical $2800–$3000 level, we could see a segmented capital rotation favoring high-narrative, high-liquidity altcoins, rather than a traditional full-blown altcoin season.”
Altcoin season, typically defined as a period when 75% of the top 50 altcoins outperform Bitcoin, appears either delayed or segmented this cycle. Experts support a theory of focused rotation into specific narratives instead of broad altcoin outperformance.
Expert commentary
Ruslan Lienkha, Chief of Markets at YouHodler, told Crypto.news in a written note that recent activity suggests a correction rather than a full reversal.
Lienkha noted that Bitcoin has spent most of 2025 trading between $90,000 and $110,000, a key consolidation zone saturated with market orders. This suggests strong interest and potential support. He believes another leg up is likely, with BTC potentially rallying to a new all-time high after more range-bound trading.
James Toledano, Chief Operating Officer at Unity Wallet said,
“Bitcoin’s rally to a new all-time high of almost $112,000 has already priced in bullish catalysts like institutional inflows and geopolitical uncertainty. As liquidity tightens ahead of key economic data, traders are likely adopting a wait-and-see approach. I see it as a stabilization and not a stall, reflecting a classic consolidation phase after strong gains earlier in the month. With open interest still high and funding rates relatively neutral, this sideways movement suggests a temporary breather rather than a trend reversal.”
Toledano is in agreement with Lienkha on a temporary breather and a return to the all-time high as Bitcoin consolidates in a key support zone.
Bitunix analysts also commented on macroeconomic factors influencing Bitcoin price. They noted that the latest Federal Reserve minutes signal a “dove in hawk” stance, with the policy direction still unclear. The analysts Analysts stated in a seperate note:
“BTC as a high volatility asset is the first to bear the brunt of uncertainty, technically we need to pay attention to the support zone of $107,700-$106,500, if it breaks down, it may be down to $105,000, and the upper pressure of $110,800-$112,000, we recommend to wait and see before a breakthrough.”
Disclosure: This article does not represent investment advice. The content and materials featured on this page are for educational purposes only.