Pullback or power-up? Bitcoin dips as demand roars on (UPDATED)


After soaring to a record high of nearly $112,000, Bitcoin has slipped amid a wave of profit-taking, rising geopolitical tension, and cautious signals from the Federal Reserve. The 7% dip, while notable, comes in the context of a broader rally driven by surging demand for spot ETFs and a tightening supply.
With Bitcoin (BTC) adoption accelerating—companies like GameStop and Trump Media adding it to their treasuries—and daily mining output capped at just 450 coins, the recent pullback may simply be a pause in what many investors view as a longer-term structural uptrend.
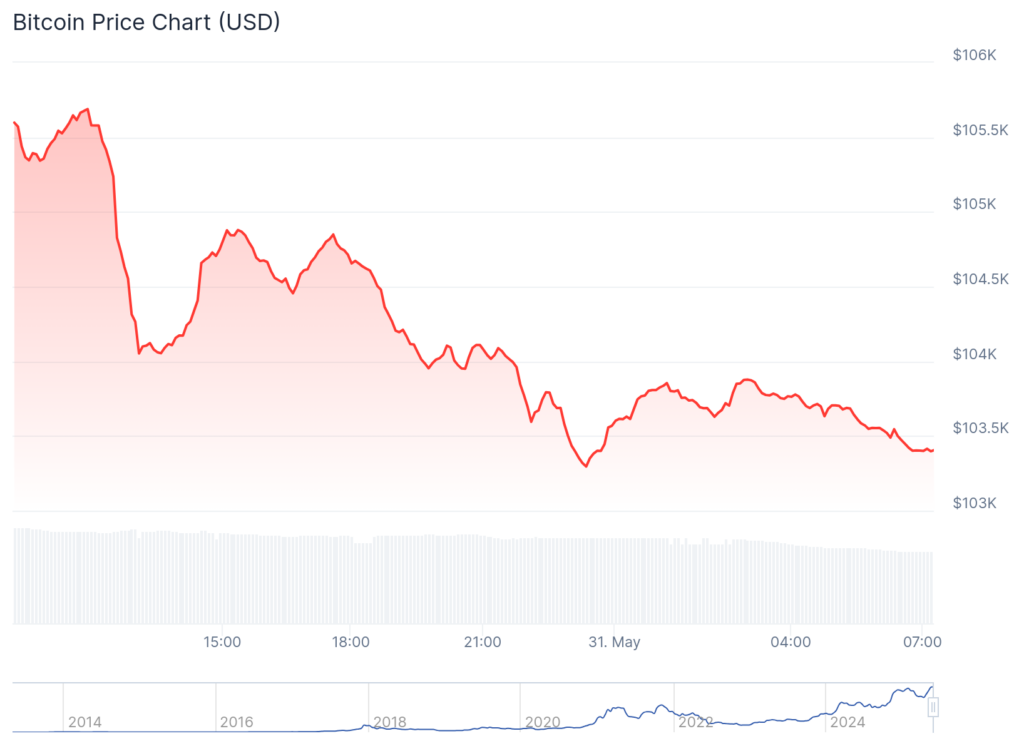
Consider the numbers: Bitcoin dropped to below $104,000 on Saturday, down by 7% from its all-time high of $111,900.
The decline occurred as investors booked profits after it jumped by 50% from its lowest point in April to its highest level this month. It is common for Bitcoin and other assets to drop after such a strong rally.
Bitcoin also dropped as concerns about trade rose. Scott Bessent, the Treasury Secretary, said that talks between the U.S. and China had stalled, while Trump accused China of not honoring its commitments. He also said that the U.S. would increase its tariffs on steel and aluminum to 50%.
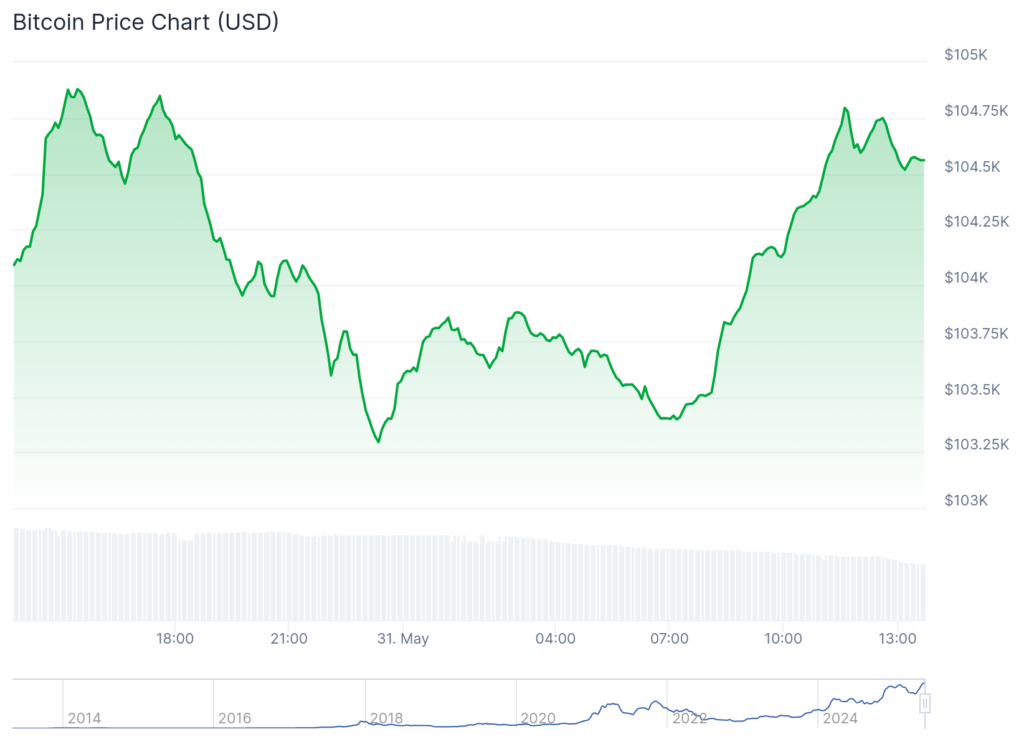
At last check on Saturday, Bitcoin hovered above $104,550. See below.
Meanwhile, the Federal Reserve minutes showed that officials are not in a hurry to cut interest rates. Instead, they are having a wait-and-see approach as they observe the impact of tariffs on the economy.
Fortunately, Bitcoin has strong supply and demand dynamics. Demand for spot Bitcoin ETFs is rising, with the cumulative inflows rising to over $44 billion. Companies like Trump Media and GameStop have started buying Bitcoin for their treasury.
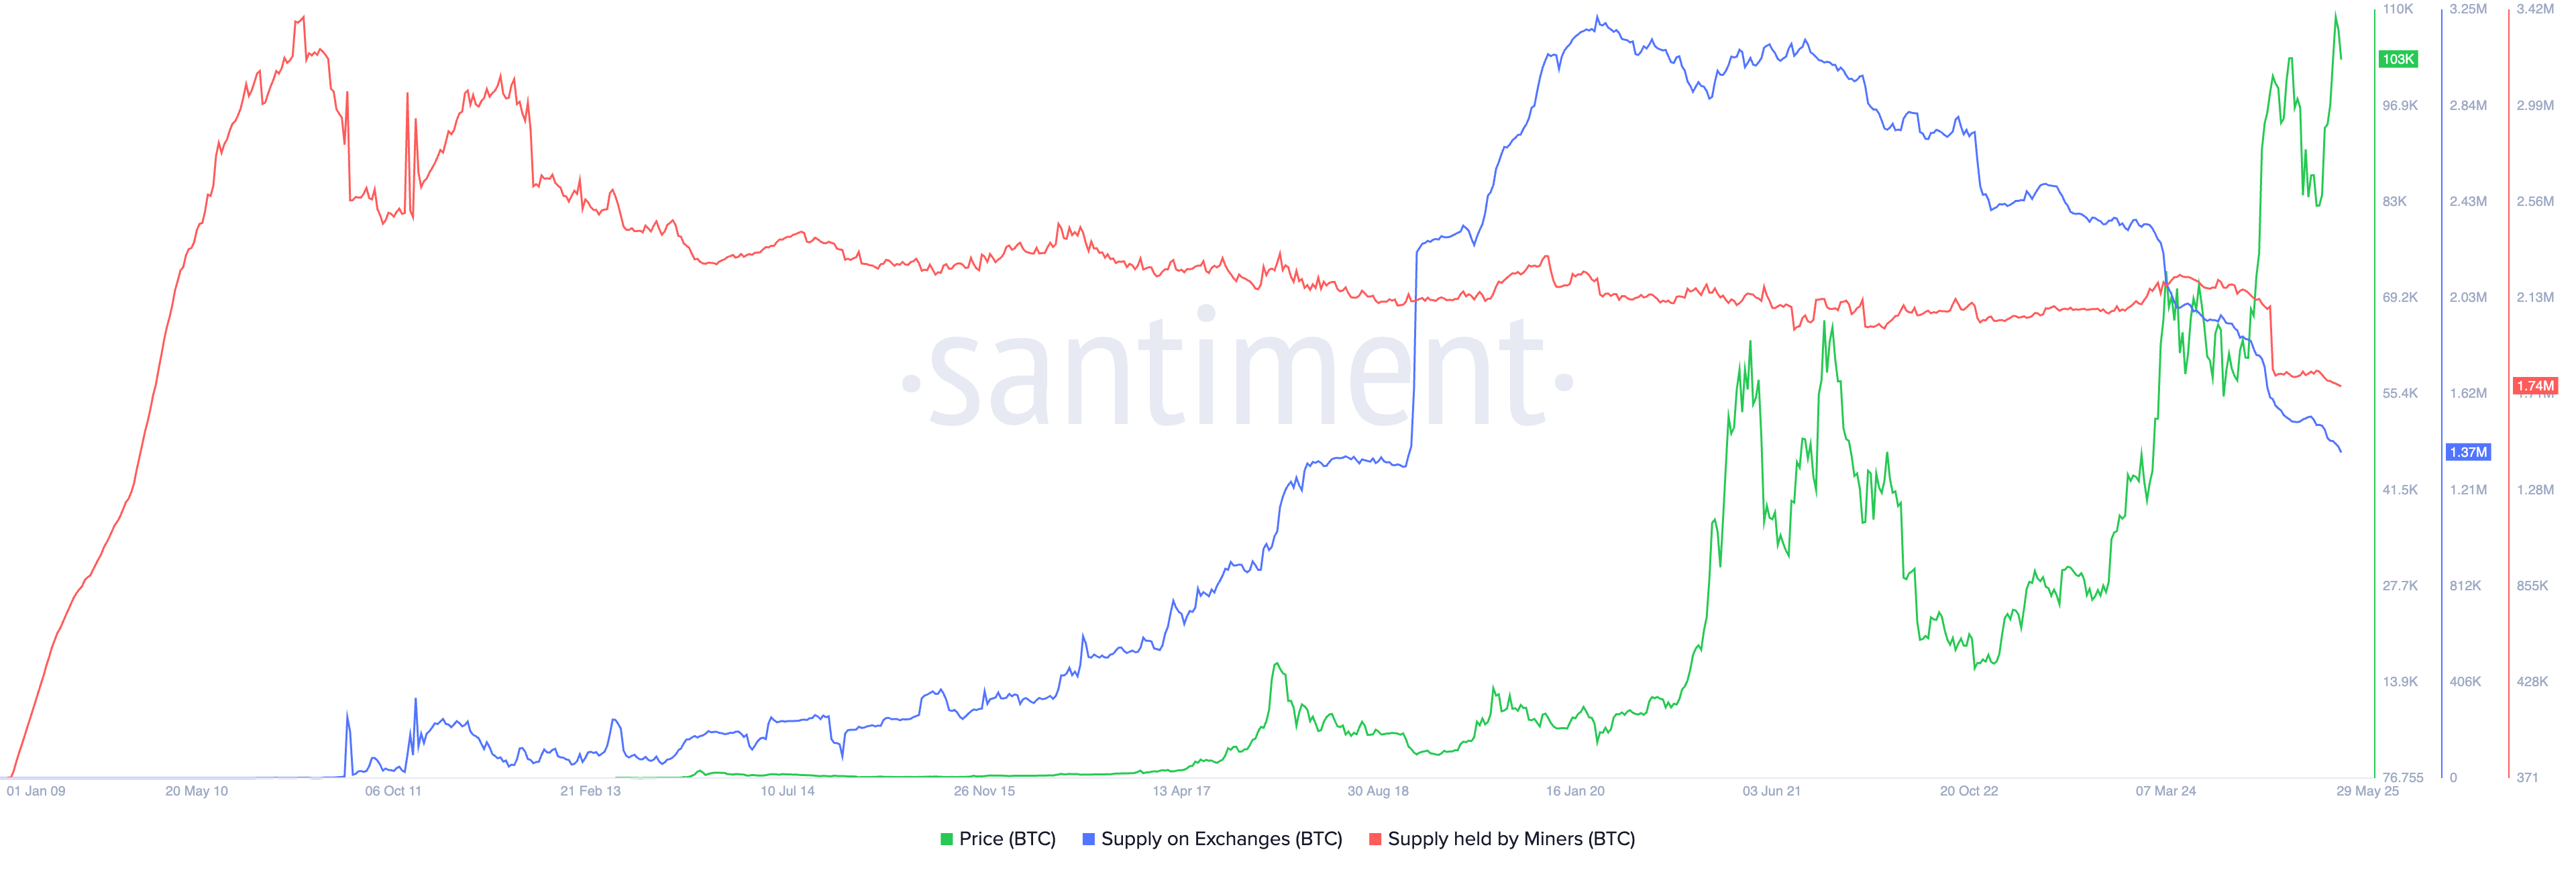
At the same time, the supply of Bitcoin on exchanges has dropped by 57% from its highest point in March 2020, and the decline is accelerating. Bitcoin’s supply has dropped from 3.22 million to 1.37 million in the same period.
This supply crunch may keep falling since only 450 coins are mined daily, and a company like Strategy is buying thousands a week. The supply held by miners has dropped to 1.74 million, its lowest level since 2010. Therefore, the supply and demand dynamics mean that the coin will continue rising.
Bitcoin price technical analysis
The daily chart below shows that the BTC price has fallen from its all-time high of $111,900 to $104,170.
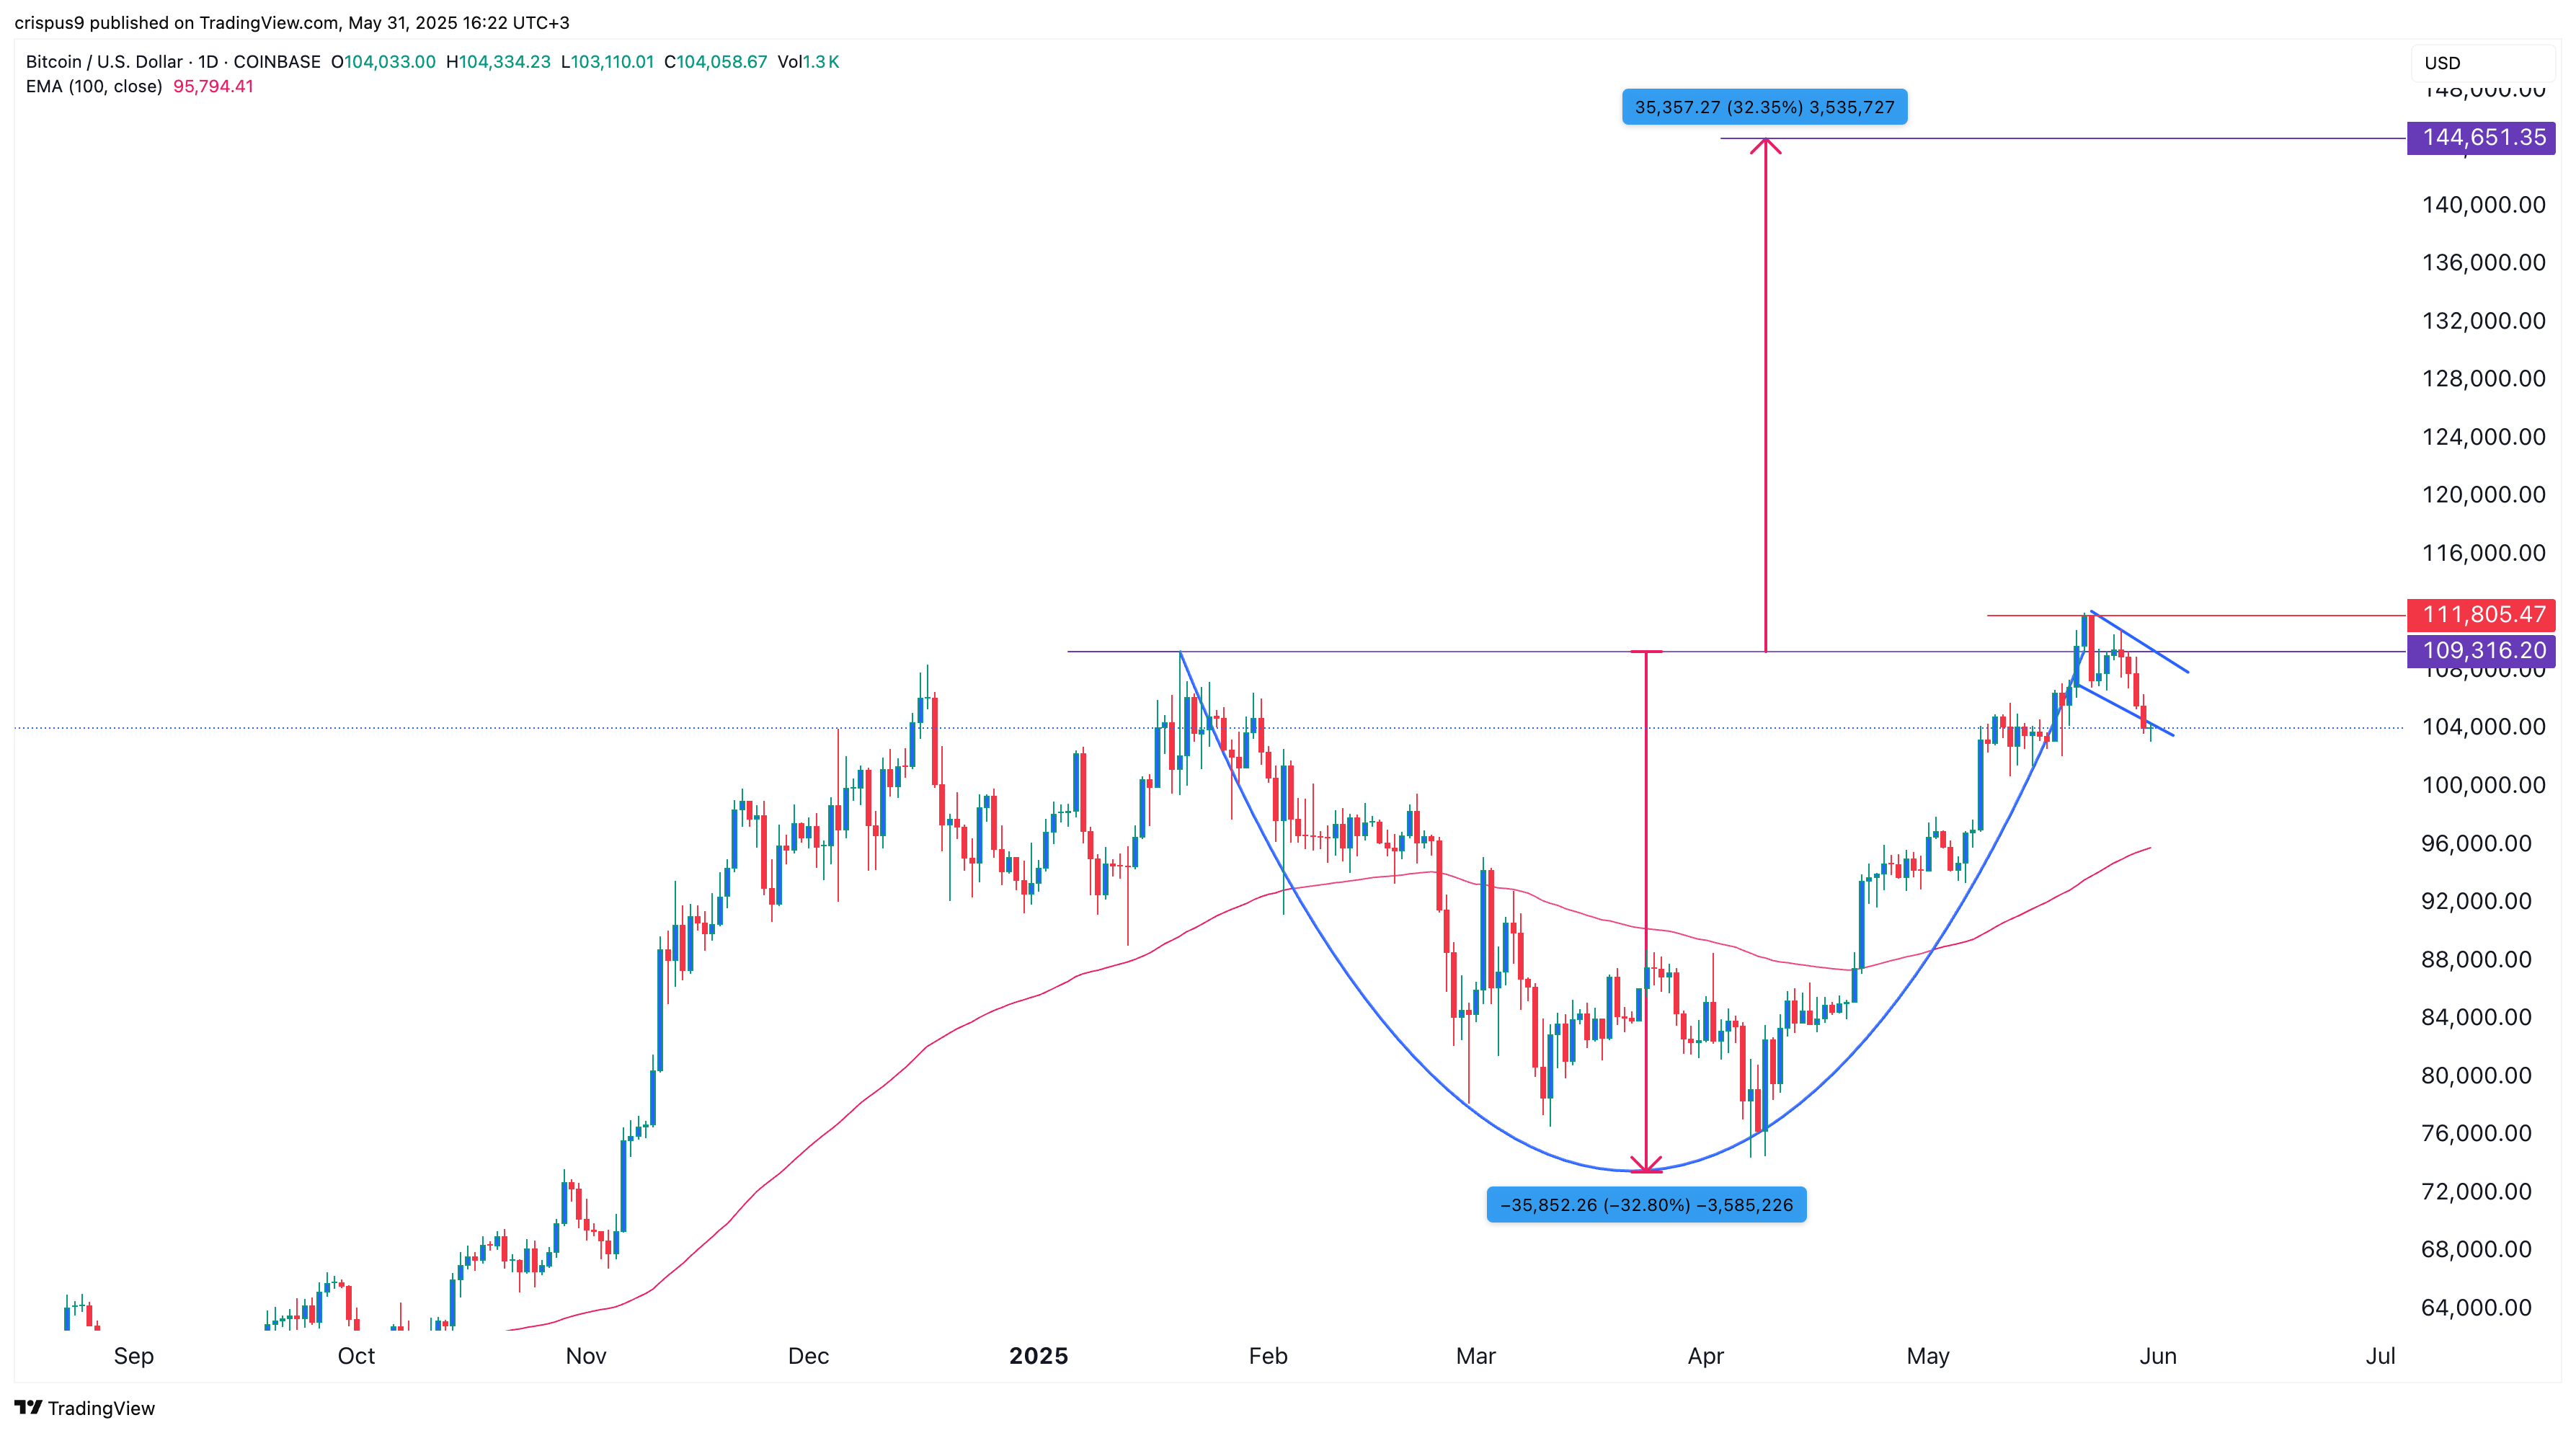
This chart shows that it has remained above the 50-day and 100-day Exponential Moving Averages. Also, it has formed a bullish flag pattern, a popular continuation sign in technical analysis.
The Bitcoin price has formed a cup-and-handle pattern and is currently in the handle phase. The depth of the cup is approximately 32%, which implies a target price of $144,650. This target is calculated by measuring the depth of the cup from its upper edge.