Bitcoin ETFs log 4th straight day of outflows as BTC drops below $89K


Institutional demand for Bitcoin remained flat as the legacy crypto briefly lost another key support level ahead of the Bank of Japan interest rate decision.
- Bitcoin ETFs have hit a four-day outflow streak totalling $1.6 billion.
- BTC has lost the $90k support as the investors reacted to macro pressures.
- Short-term technicals remain in favor of more downside.
According to data from SoSoValue, the 12 spot Bitcoin ETFs in the U.S. recorded $32 million net outflows on Thursday, Jan. 22. BlackRock’s IBIT led with $22.3 million of outflows, while Fidelity’s FBTC followed with $9.7 million. None of the remaining BTC ETFs recorded any flows on the day.
Bitcoin ETFs extended their outflow streak to 4 consecutive days that saw a combined $1.6 billion exit the investment products, pushing total outflows this month to $14.55 million. It may now be on track to close another negative month after $3.48 billion was lost in November and $1.09 billion exited the funds in December.
Thursday’s outflows were fueled by a climate of ‘extreme fear’ as investors braced for the Bank of Japan’s interest rate decision. Markets were on edge over a potential hold at 0.75%, a level not seen in three decades. High interest rates typically strengthen the Yen and dampen the appeal of risk assets, including cryptocurrencies like BTC.
However, the Japanese bank has held the rate steady in line with market-wide expectations, thereby alleviating immediate pressure on global risk assets.
Bitcoin (BTC) fell to an intraday low of $88,557 after losing $90k on Thursday before managing to recoup some of the losses after the BoJ’s decision
Nevertheless, Bitcoin price remains at risk unless it can reclaim the psychological support at $90K. At press time, the bellwether was trading roughly 10% below the next key psychological resistance at $100k, a level it lost around mid-November last year.
Bitcoin price analysis
On the daily chart, Bitcoin price action shows that it has dropped below an ascending trendline that had been acting as support since late November last year. Each time Bitcoin dropped below this level, bulls managed to stir it back to its previous trajectory. The loss of this critical floor now puts Bitcoin at risk of a deeper correction.
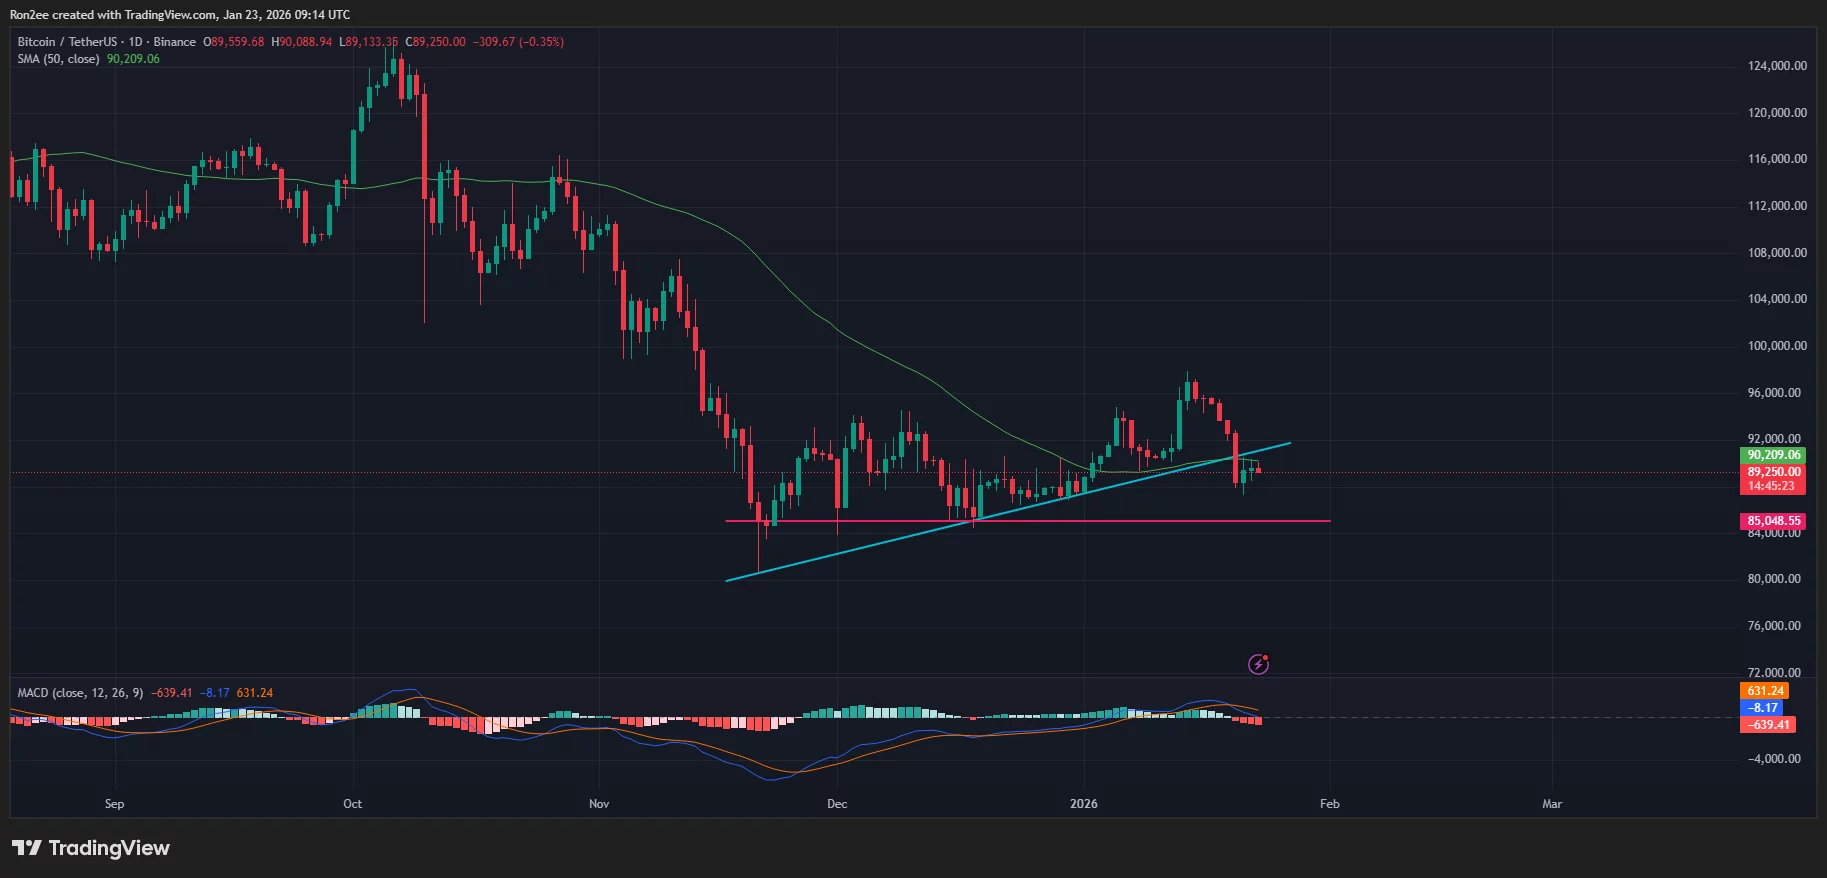
Bitcoin has also dropped below the 50-day simple moving average, suggesting that selling pressure has intensified and momentum is shifting in favor of the sellers.
On top of this, the MACD indicator, which gauges trend strength and direction, showed that a bearish crossover was at play.
For now, it is likely that Bitcoin may continue its downtrend with bears potentially targeting a return to the mid-December low of $85,000.
On the contrary, a decisive rebound back above $90k would invalidate the bearish forecast and position it for a potential recovery towards its January high of $97,538.
Disclosure: This article does not represent investment advice. The content and materials featured on this page are for educational purposes only.