Bitcoin, Ether, Major Altcoins – Weekly Market Update April 18, 2022

The total crypto market cap erased $77 billion from its value in the last seven days and now stands at $1.81 billion. The top 10 coins were all in red for the same time period with Terra (LUNA) and Cardano (ADA) being the worst performers with 13.9 and 13.7 percent of losses respectively. Bitcoin (BTC) is currently trading at $39,037 while ether (ETH) is at 2,911.
BTC/USD
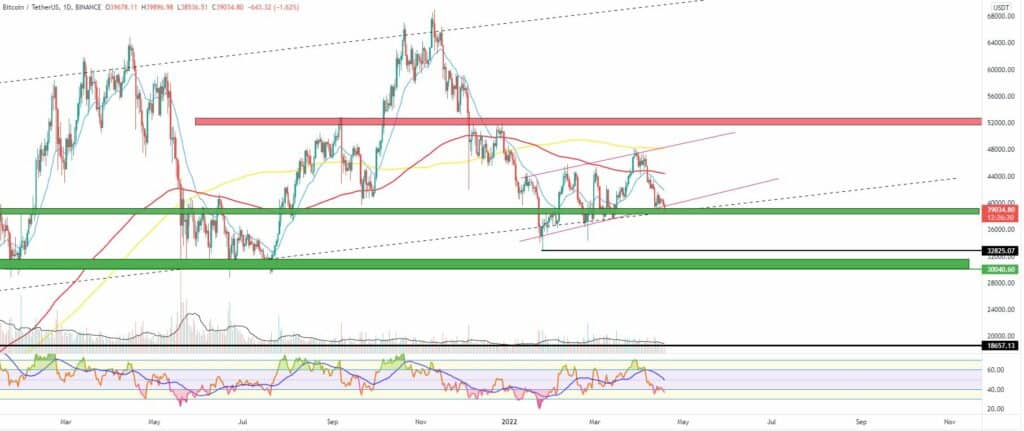
Bitcoin closed the trading day on Sunday, April 10 at $42,237 after losing the 21-day EMA on both the daily and weekly timeframes earlier in the week.
The reversal to the upside was short-lived, but the price of BTC kept trading inside the bear flag formation without being able to break it in either direction.
On Monday, the coin fell sharply to $39,500 erasing 6.2 percent while touching the lower boundary of the mentioned bear flat figure. It was also dangerously close to the lower side of the long-term uptrend corridor, situated at $38,600. The RSI indicator went back into the oversold area stimulating bulls to come back to the playground.
The BTC/USDT pair bounced back up from the diagonal support and on Tuesday, April 12 reached $40,100 but not before hitting $40,800 during the intraday session.
The mid-week session on Wednesday came with a second consecutive green candle on the 1-Day chart as BTC climbed up to $41,100.
On Thursday, April 14 we witnessed a sudden reversal as bears pushed the price all the way down to $39,942 or 3 percent lower, fully engulfing the previous candle on the daily chart. The weakness of the uptrend was visible on the trading volumes data. The 24-hour average values were decreasing steadily.
The last day of the workweek came with a quick jump to $40,511, but the zone around $42,000 remained the biggest obstacle in front of buyers.
The weekend of April 16-17 started with a negligible red candle on Saturday. BTC corrected its price down to $40,380, up from a $40,000 daily low.
Then on Sunday, it dropped down to $39,611, which resulted in a 1.8 percent price pullback.
What we are seeing on Monday is a continuation of the selloff. BTC is trading below $40,000k.

ETH/USD
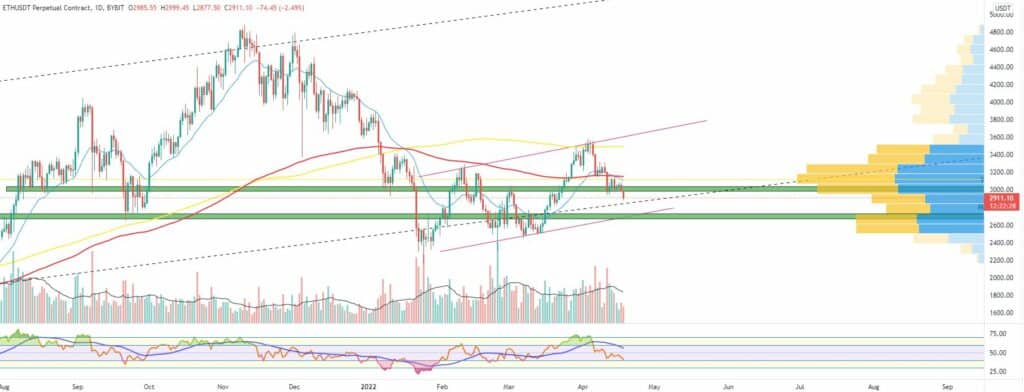
The Ethereum Project token ETH hit resistance around the 200 MA in early April and fell down to $3,192 on Sunday, April 10. It ended the previous seven-day period with a 9.4 percent loss but somehow managed to keep floating above the 21-period EMA on the weekly timeframe.
On Monday, the ETH/USDT pair dropped to $2,977, or right below the horizontal support, and erased 7 percent of its market capitalization. Just like bitcoin, the ether was now trading in a wide uptrend corridor with a low boundary somewhere near the $2700-$2,800 monthly horizontal support. It managed to stabilize its price around the mid-zone ($3,000).
The Tuesday session was more positive for bulls as they were able to form a green candle to $3,043 and avoid further decreases.
The move was followed by a continuation of the reversal as ETH reached $3,122 on the third day of the workweek.
The RSI indicator was nowhere near the oversold or overbought areas, but the lack of overall buying momentum could suggest more downside once the leading altcoin re-visits the $3,300 mark, depending on how BTC reacts around its resistance levels.
On Thursday, April 14, the ether fell sharply to $3,015 losing 3.2 percent of its market cap. It was rejected at the 21-period EMA on the weekly chart which resulted in a re-test of the horizontal support on that timeframe.
The Friday session came with a short green candle to $3,038 as the price was now hovering around one of the most actively traded zone according to the VPVR indicator.
The first day of the weekend was marked by low volatility as the ETH token remained almost flat in the $3,050 area. The trading volumes were quite low as a result of the Easter holidays in the Catholic world.
On Sunday the biggest altcoin once again hit the support level around $3,000 losing 2.4 percent.
It is trading slightly lower, at $2,910 as of the time of writing.

Leading Majors
- XRP (XRP)
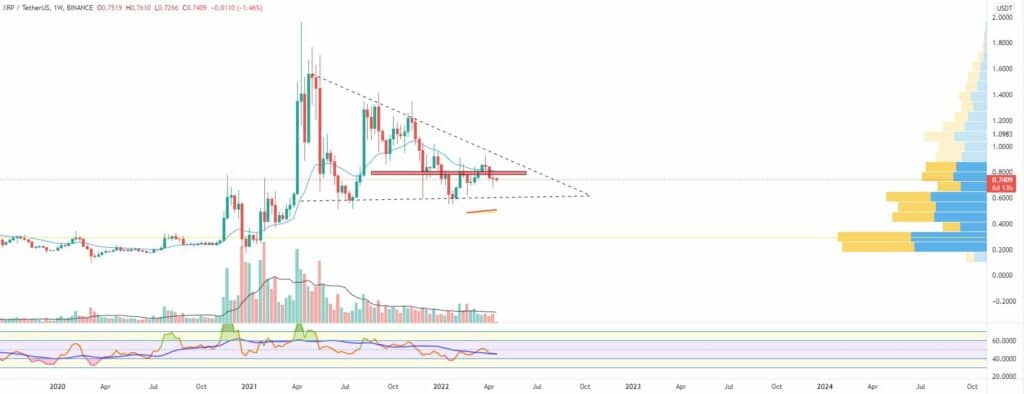
XRP was the best performing asset in the Top 10 list. It remained flat for the week bouncing up after hitting a weekly low of $0.685 as bulls were preparing for an attack of the dynamic resistance around the 21-period EMA and the $0.80 multi-timeframe horizontal resistance.
The main reason behind the recent relatively stable performance of the notoriously volatile legacy cryptocurrency is the positive news on the ongoing lawsuit against the Ripple company by the US Security and Exchange Commission (SEC) in the last few days. The judge on the case denied the SEC’s request to reconsider shielding documents related to a speech by the former agency director William Hinman where the called both BTC and ETH are not securities. This was praised by the Ripple executives as a big victory for the company.
Still, the XRPUSDT pair is trading in a descending triangle pattern since April 2021. The next resistance in front of bulls will be the mentioned horizontal followed by the long-term downtrend line. Support at $0.61.

Altcoin of the week
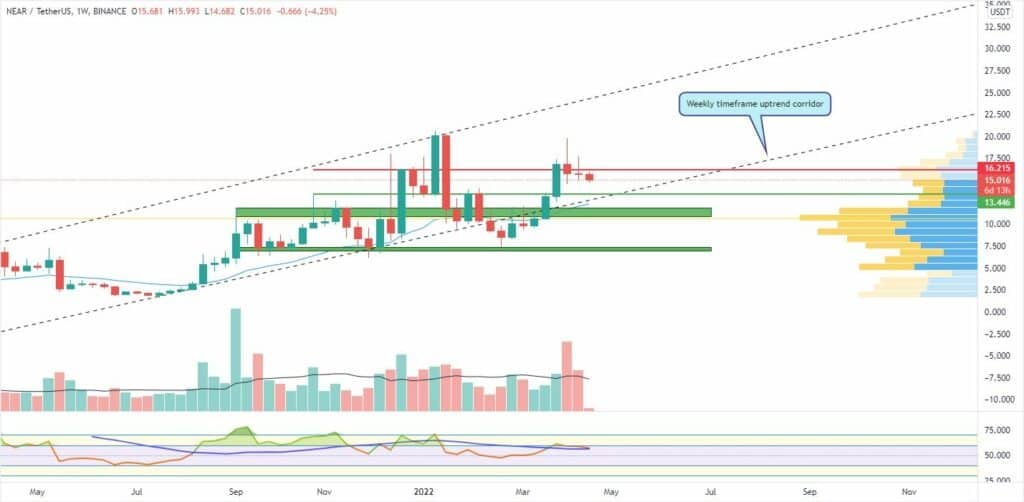
Our Altcoin of the week is NEAR. The popular Layer 1 solution is trading again in its long-term uptrend corridor after staying below it for more than a month. It ended the previous seven-day period flat, stable above the February 2022 high.
The NEAR/USDT pair is currently trading close to the $16 resistance level. A consolidation here will allow bulls to attack the all-time high of $20.6 and the upper boundary of the mentioned long-term corridor. Support at $13.5
NEAR is currently ranked at #17 on CoinGecko with a total market capitalization of approximately $11.05 billion. The total value locked in the ecosystem grew by 24.5 on a weekly basis – the biggest jump among the Top 20 chains.


