Bitcoin, Ether, Major Altcoins – Weekly Market Update August 1, 2022

The cryptocurrency market added $69 billion to its market cap during the last seven days and now stands at $1,078 billion. The top 10 coins were all in green for the same time period with Polkadot (DOT) and Binance Coin (BNB) being the biggest gainers with 14.6 and 9.2 percent of gains respectively. Bitcoin (BTC) is currently trading at $23,200 while ether (ETH) is at 1,664.
BTC/USD
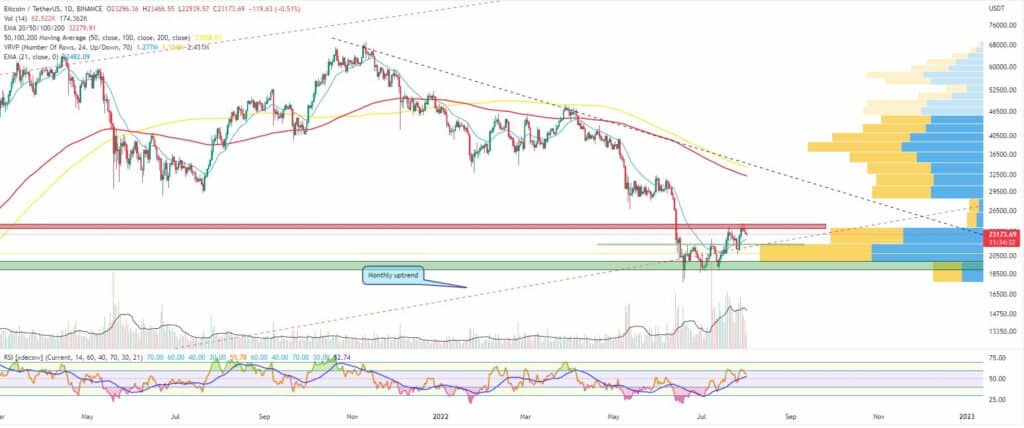
Bitcoin ended the previous seven-day period with a solid green candle on the weekly timeframe chart and an 8 percent price increase. The coin confirmed the breakout of the old range and the high at $22,000 and tested the 200-day Moving Average (MA). What is more, bulls attempted to break the diagonal resistance line on the daily chart near $24,500, but the short-term rally had already exhausted its strength resulting in a price pullback.
On Monday, July 25, the BTC/USDT pair unexpectedly lost 6 percent of its valuation and dropped down to $21,300 thus losing the horizontal support. It also lost the 21-day EMA and slide even lower on Tuesday to grab the underlying liquidity before reversing back to the upside.
The third day of the workweek brought some extreme volatility to the charts caused by the United States Federal Reserve Open Market Committee (FOMC) meeting where a fresh new 0.75 percent interest rate hike was announced. The markets reacted positively and BTC rallied all the way up to $23,000 engulfing all four previous sessions. It increased by 8 percent.
On Thursday, July 28 we saw a continuation of the uptrend as bulls pushed BTC above both the diagonal resistance and the last daily candle close high at$23,400. The coin re-entered the liquidity gap area above $23,500 while the 24-hour trading volumes remain relatively high. The Relative Strength Index (RSI) was looking to enter the overbought zone.
The Friday session brought some signs of exhaustion. The biggest cryptocurrency closed in red after peaking at $24,400. It could not extend the rally on the first day of the weekend either and only was able to hit $24,650 during the intraday trading before falling back down to $23,620.
On Sunday, it dropped to $23,240, erasing 1.5 percent on the last day of July. The BTC/USDT pair ended the previous month with a 15 percent growth.
It is trading flat on Monday.
ETH/USD
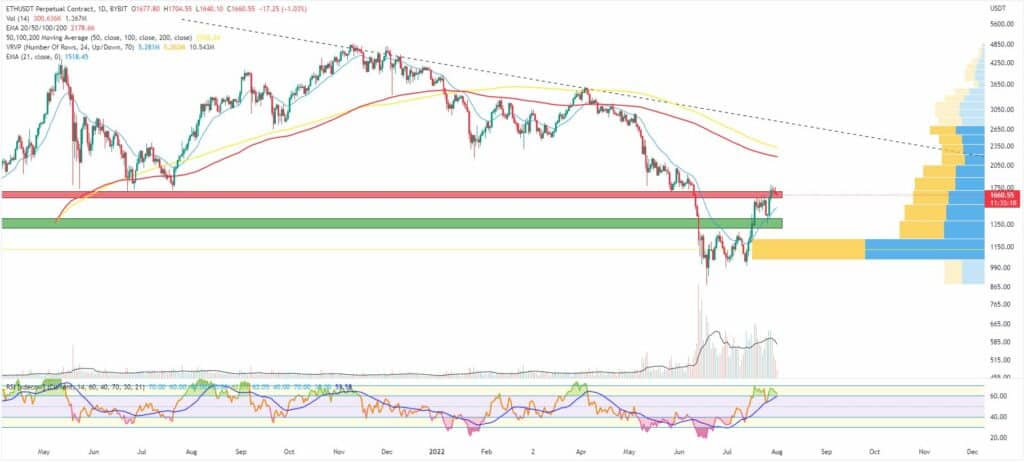
The Ethereum project token ETH was trading in a range in the period between 18 and 24 July after rallying more than 55 percent in the last few weeks. The leading altcoin was one of the most traded coins thanks to its strong fundamentals and the upcoming Proof of Stake (PoS) merge. It closed its third-consecutive weekly candle in green, this time adding 19 percent.
On Monday, July 25 the ETH/USDT pair fell sharply to $1,440, which resulted in a 10 percent correction.
It moved even lower on Tuesday, briefly touching the $1,360 mark, but the horizontal support area and the 21-day EMA provided the required stability and bulls avoided further decrease.
The mid-week session on Wednesday came with a quick change of directions. ETH reversed to the upside and climbed all the way up to $1,630 or 13 percent higher. It was once again flirting with the extremely stable support/resistance area around $1,700.
On Thursday, July 28 the ether pushed above the short-term horizontal resistance at the $1,630 mark. The uptrend though started to look a little exhausted after filling the liquidity gap opened during the last market crash at the beginning of June. The RSI was spending too much time in the overbought area.
The ETH/USDT pair remained flat on Friday but then started moving South at the beginning of the July 30-31 weekend. First, on Saturday, it hit $1,700 then it continued to lose ground on Sunday ending the month of July with a 56 percent gains.
What we are seeing midday on Monday is another red day for the ether. Bears will be looking for a re-test of the mentioned $1,630 level which was acting as resistance last week.
Leading Majors
- Polkadot (DOT)
Surprisingly or not, Polkadot was the best performing digital asset in the Top 10 last week.
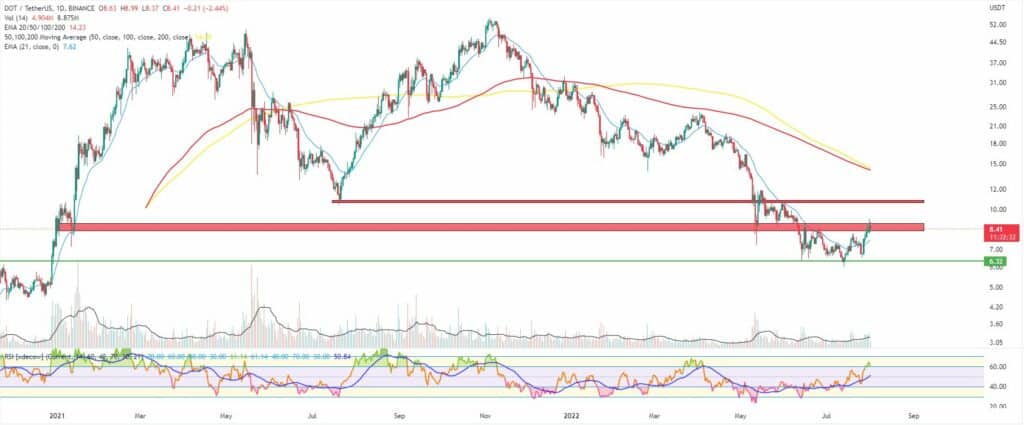
The coin usually mimics the move of Bitcoin, but on a larger scale and the recent rally was no exception. It increased by 17.5 percent for the period and reached the upper boundary of the resistance zone on the weekly timeframe.
DOT is currently trading at $8.5, struggling to break above the $9 mark which was significant support back in May and early June. If the trading volumes remain strong and bulls prevail, this will make the uptrend continuation to $12 highly probable.
The fundamentals are strong for Polkadot, but it still lacks the user base and actual engagement, which makes it somehow undervalued compared to Solana and Cardano chains.
Altcoin of the week
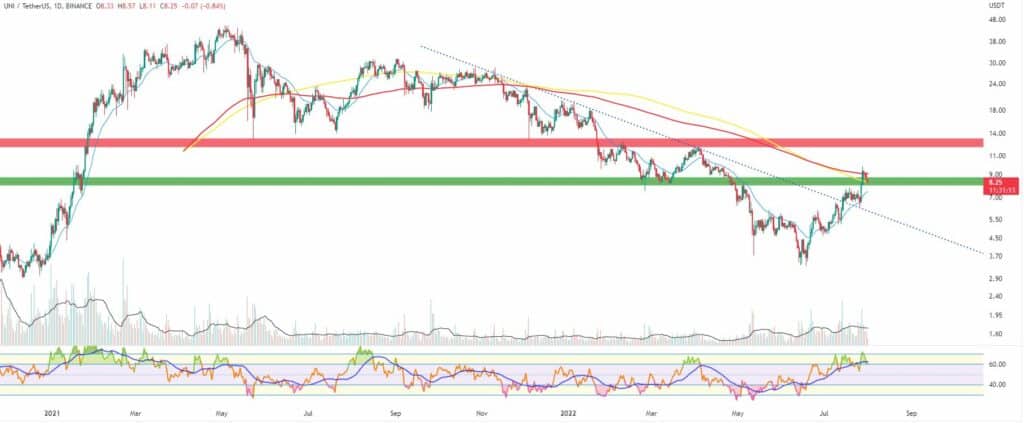
Our Altcoin of the week is Uniswap (UNI). Uniswap is another legacy DeFi token. Considered by many as the original DeFi blue chip, it is once again on the rise thanks to a series of announcements (NFT marketplace Genie acquisition, trading fees switch voting and the upcoming Ethereum merge to name a few), and the relatively stable technical.
The coin added 15 percent to its valuation during the last seven days but was trading 36 percent above its last weekly candle close at one point in time. The solid uptrend started on June 18 when the token bottomed at $3.36. Since then, it managed to add more than 150 percent to its valuation (as of the time of writing) surpassing the 21-day EMA on both the daily and weekly timeframe before hitting the last lower low before the crash – $8.2. If we see a successful breakout here then this will open the door for an attack of the area between $12 and $13 – a significant support/resistance on the bigger timeframes.
UNI is now ranked at #24 on CoinGecko with a total market cap of $3.7 billion.
