Bitcoin, Ether, Major Altcoins – Weekly Market Update August 2, 2021

The total crypto market cap added $71 billion to its value for the last seven-days and now stands at $1,608 billion. The top 10 coins were all in green for the same time period with Polkadot (DOT) and XRP (XRP) leading the pack with 31.9 and 22.4 percent of price increase respectively. Bitcoin (BTC) is currently trading at $39,530 while ether (ETH) is at $2,589.
BTC/USD
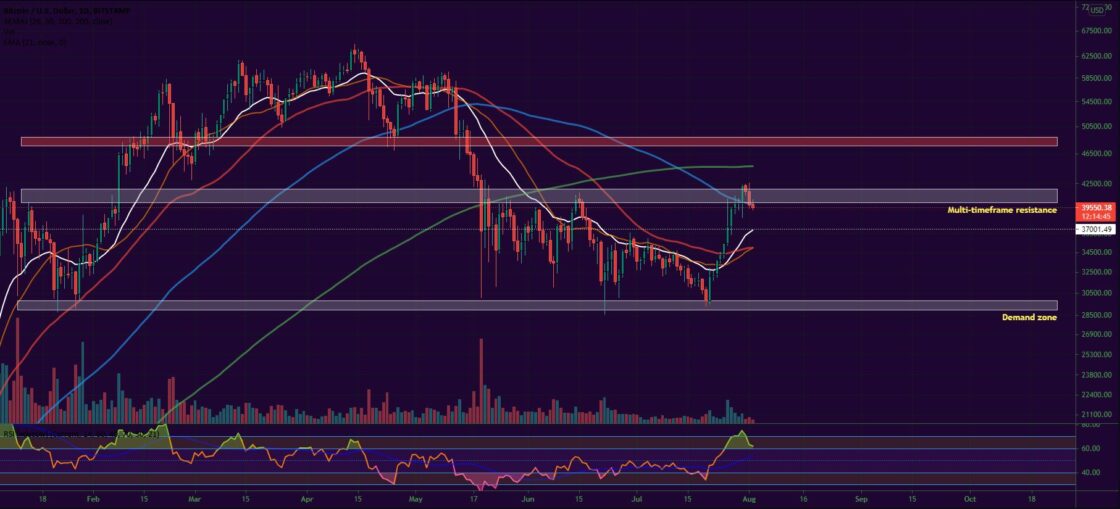
Bitcoin closed the trading session on Sunday, July 25 at $35,400 and after five consecutive days in green managed to closed the seven-day period with a 11.4 percent increase and 21 percent up from the $29,300 low registered on July 20.
The coin moved above all short-term EMAs on the daily chart in the aftermath of what was, according to many veteran traders, the final capitulation before the bull run re-start.
On Monday, the BTC/USDT pair went parabolic on the news that the largest e-commerce company in the world Amazon was getting ready to accept bitcoin and other cryptocurrency as a payment method in the coming months as well as to start working on its own digital asset project. Bitcoin jumped 14 percent to $40,500, but retraced 8 percent of the move almost immediately once Amazon denied the rumors. Still, it touched the $40k mark for the first time since June 16.
Buyers, however, were not that quick to capitulate and on Tuesday pushed the price further up to $39,350 or another 5.8 percent. The RSI and Stoch RSI indicators were both on overbought territory while 24-hour trading volumes were declining.
The mid-week session on Wednesday came with another attempt to break above $41,000, but again sellers were there to react. BTC closed at $40,000.
On Thursday, July 29 the coin remained flat in the zone below the 100-day EMA.
The move was followed by another solid price increase on Friday. After falling to $38,270 in the early hours of trading, Bitcoin climbed all the way up to $42,224 and added 5.5 percent or $2,060 to its valuation. It is worth mentioning that the coin broke the bearish market structure and closed above the previous high thus forming a higher high on the daily chart.
The weekend started with a small pullback to $41,500 on Saturday, but still, BTC ended the month of July 17 percent higher, fully engulfing the previous monthly candle.
Then on Sunday, August 1, it dropped further down to $39,870, losing another 3.4 percent.
What we are seeing midday on Monday is a third consecutive day in red.

ETH/USD
The Ethereum Project token ETH closed flat at $2,185 on Sunday, July 15, but that did not stop it from adding 15.3 to its value on a weekly basis. The move helped it surpass the 21-EMA on the weekly timeframe and also break above the falling wedge formation, usually a bullish reversal signal.
On Monday, the ether continued to rise. It climbed up to $2,228 at the daily candle close after hitting $2,430 during intraday on the already-mentioned false Amazon rumor.
The Tuesday session was a good one for bulls as well. The ETH/USDT pair first dropped to $2,150 in the early hours of trading, then recovered in the evening pushing its price further up to $2,300.
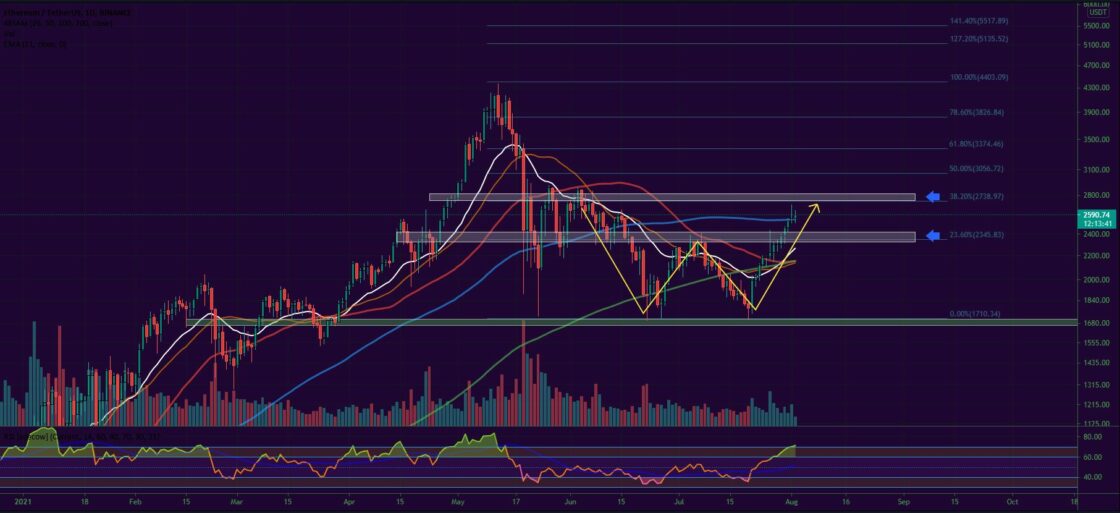
The third day of the workweek was when the coin reached the important daily/weekly timeframe resistance right below $2,400. That key zone was one of the most actively traded in the last few months providing support and resistance on multiple occasions, including the last registered peak from early July.
The leading altcoin closed the day flat after trading in the wide $2,240-$2,345 range.
On Thursday, July 29, it made one more step in the upward direction, this time to the zone above the Fibonacci 23.60 level at 2,380.
The Friday session was no different and the ether continued to increase in value forming another green candle to $2,456. The ETH/USDT pair was now forming a bullish W pattern on the daily chart with a breakout line around $2,800 around the June high and the Fibonacci 38.20 level.
The first day of the weekend came with 11th consecutive day in green for the altcoin and a fresh new monthly high – $2,528. The month of July was closed with a 10 percent increase.
On Sunday, August first, the ETH token hit $2,697 but sellers quickly absorbed the buy orders and pushed the price down to $2,550 at the candle close.
As of the time of writing, the coin is trading slightly higher – at $2,585.

Leading Majors
- XRP (XRP)
One of the most popular cryptocurrencies from the last bull run, XRP started to grow again in the last few weeks and quickly reached #6 on CoinGecko’s Top 100 list.
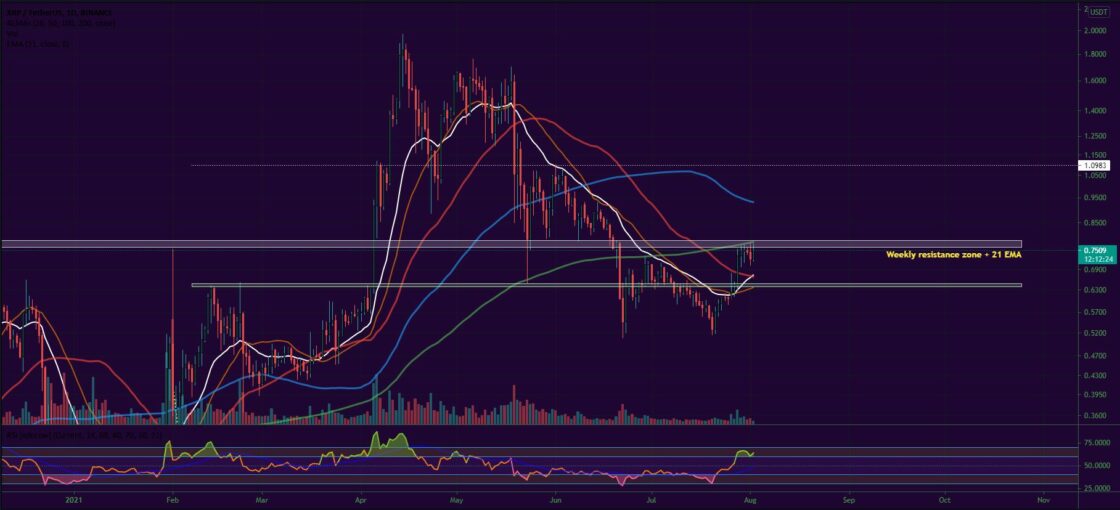
The XRPUSDT pair added 18 percent to its value for the last seven days and is now 44 percent up from its July bottom, currently trading around $0.75.
The $0.75-$0.80 area is a solid resistance that is visible on the weekly timeframe. It is where the altcoin peaked back in November, 2020 and again in February, 2021. It is also where the price of XRP found stability during the May market crash.
Next target in front of bulls, even the above zone is surpassed, will be $1.1.
Potential support at $0.65.

Altcoin of the Week
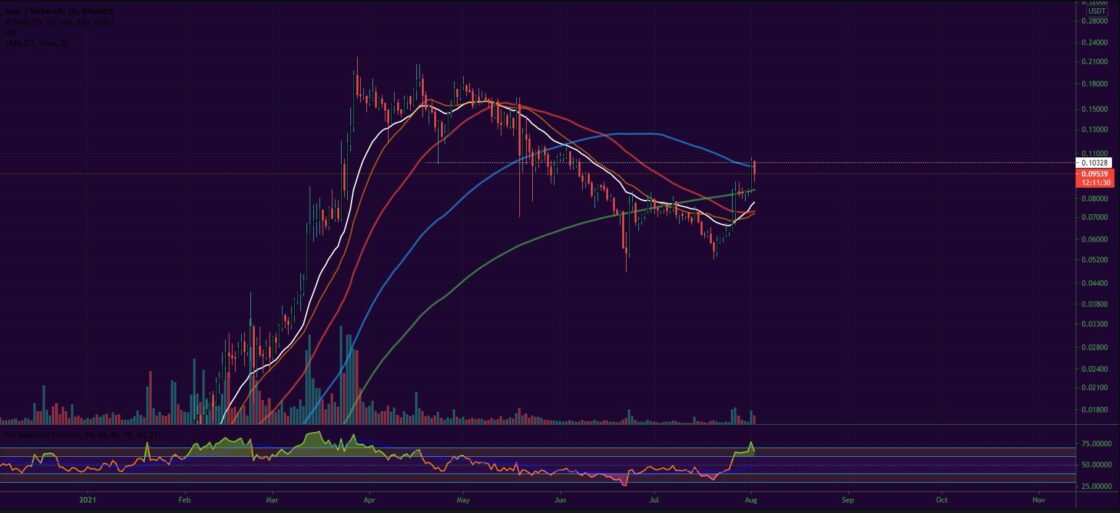
Our Altcoin of the week is Ankr (ANKR). The blockchain node hosting provider jumped with 61 percent during the last week and is now trading near the important $0.1-$0.11 support/resistance level.
The ANKR coin re-entered the Top 100 list and is now situated at #97 with a total market cap of $744 million. It peaked at $0.107 on Sunday, August 1.
The most probable reason for the recent surge is the recent listing on Binance US as well as the announced improvements in the Ankr’s Developer API, which is now also available on the Polygon ecosystem.
As of the time of writing, the ANKR/USDT pair is trading at $0.95.


