Bitcoin, Ether, Major Altcoins – Weekly Market Update December 27, 2021

The total crypto market cap added $267 billion to its value for the last seven days and now stands at $2,380 billion. The top 10 coins were all in green for the same time period with Polkadot (DOT) and Cardano (ADA) leading the group with 26.3 and 26.2 percent of gains respectively. Bitcoin (BTC) is currently trading at $50,725 while ether (ETH) is at $4,053.
BTC/USD
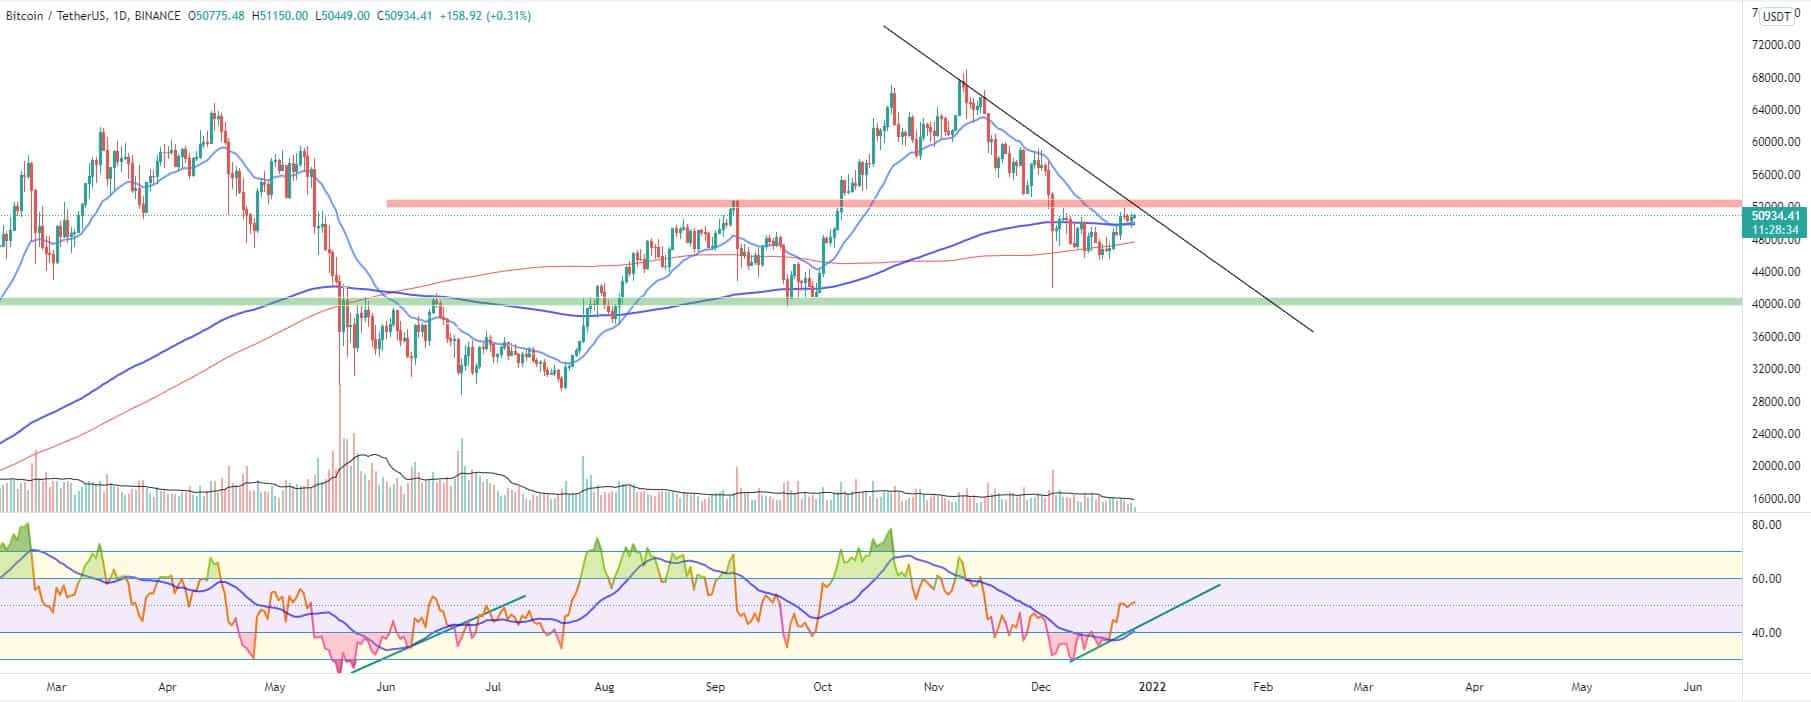
Bitcoin closed the trading day on Sunday, December 19 flat, at $46,700, and below the 200-day simple moving average.
On the daily timeframe, we could see the formation of bullish divergence between the price action and the Relative Strength Indicator (RSI) values. We saw the exact same behavior back in early June yet the coin lost 15 more percent in the subsequent weeks. In order for the divergence to be confirmed we need to have rising volumes, in synch with the price action.
The coin was 7 percent down for the previous seven-day period.
On Monday, December 20 the BTC/USDT pair dropped down to $45,500 in the early hours of trading but then managed to regain positions above $46,500. It is worth noting that the trading volumes started picking up pace again.
The Tuesday session was the best one in weeks for bulls. Bitcoin climbed up to $49,100 and added 4.5 percent to its valuation, also breaking above the short-term diagonal downtrend line.
The mid-week session on Wednesday saw BTC hitting the meeting point of the 21 and 200-day EMAs at $49,700 before dropping back down to $48,400.
On Thursday, December 23, the coin jumped 4.5 percent up, to move above the mentioned moving averages and close the session at $50,800. Bitcoin closed a daily candle above $50,000 for the first time since early December.
The Friday session was relatively calm as the biggest cryptocurrency remained flat on Christmas Eve.
The weekend of December 25-26 started with a drop to $50,300 on Saturday, which was followed by a green day on Sunday. It ended the week at $50,760 as bulls were hoping to get support at the short-term EMA and the zone above the closest point of control as per VPVR.
There is a high probability of a major Head and Shoulders pattern on the daily chart if a right shoulder is confirmed at the area around $53,000.
BTC is currently trading at $50,700.
ETH/USD
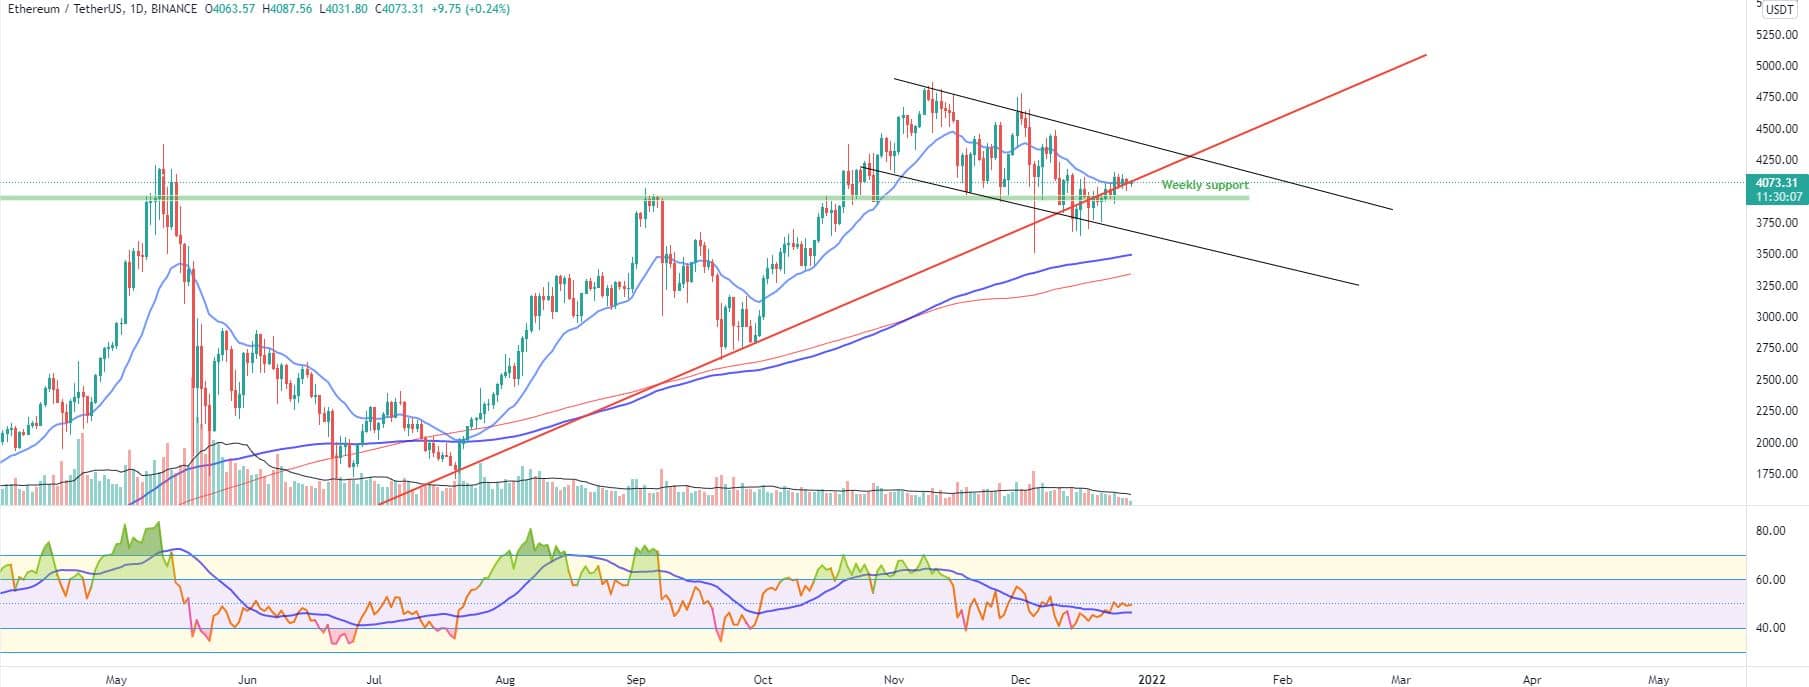
The ether remained extremely volatile, moving below the horizontal and diagonal supports in the last weeks of trading– both of them situated below the $4,000 price mark. The ETH token ended the trading day on Sunday, December 19 at $3,920.
On Monday, it fell 5.5 percent down in the morning, but the sell orders were quickly absorbed, so buyers were able to push the price up to $3,945 and to close with a short green candle. The RSI indicator was stable below 50 since the beginning of the month.
The ETH/USDT pair initiated a strong move to the upside on Tuesday, December 21 hitting the 21-day EMA around $4,064 during intraday before closing at $4,030. The coin was building an ascending triangle pattern on the last leg and a solid bull flag on the daily chart.
The third day of the workweek came with an attempt from bulls to break above the 21-day EMA dynamic resistance. It reached a daily high of $4,072 before making a full retrace at the daily candle close.
On Thursday, the ether jumped 3.2 percent up, but not before dropping below the horizontal resistance in the early hours of trading. The coin successfully broke above the mentioned moving average and the diagonal uptrend. It also came out of the heavily traded zone right above $4,000 (as per the VPVR indicator) to close the session at $4,100.
On Friday, we saw a small retrace down to $4,045 as the upside reversal remained fragile. The overall trading volumes were decreasing causing a divergence with the price action.
The first day of the weekend came with a small green candle to $4,060, which was followed by a similar candle but in the opposite direction on Sunday. ETH was building a bear flag within a bull flag on daily.
The coin is currently trading at $4,053.
Leading Majors
- Polygon (MATIC)
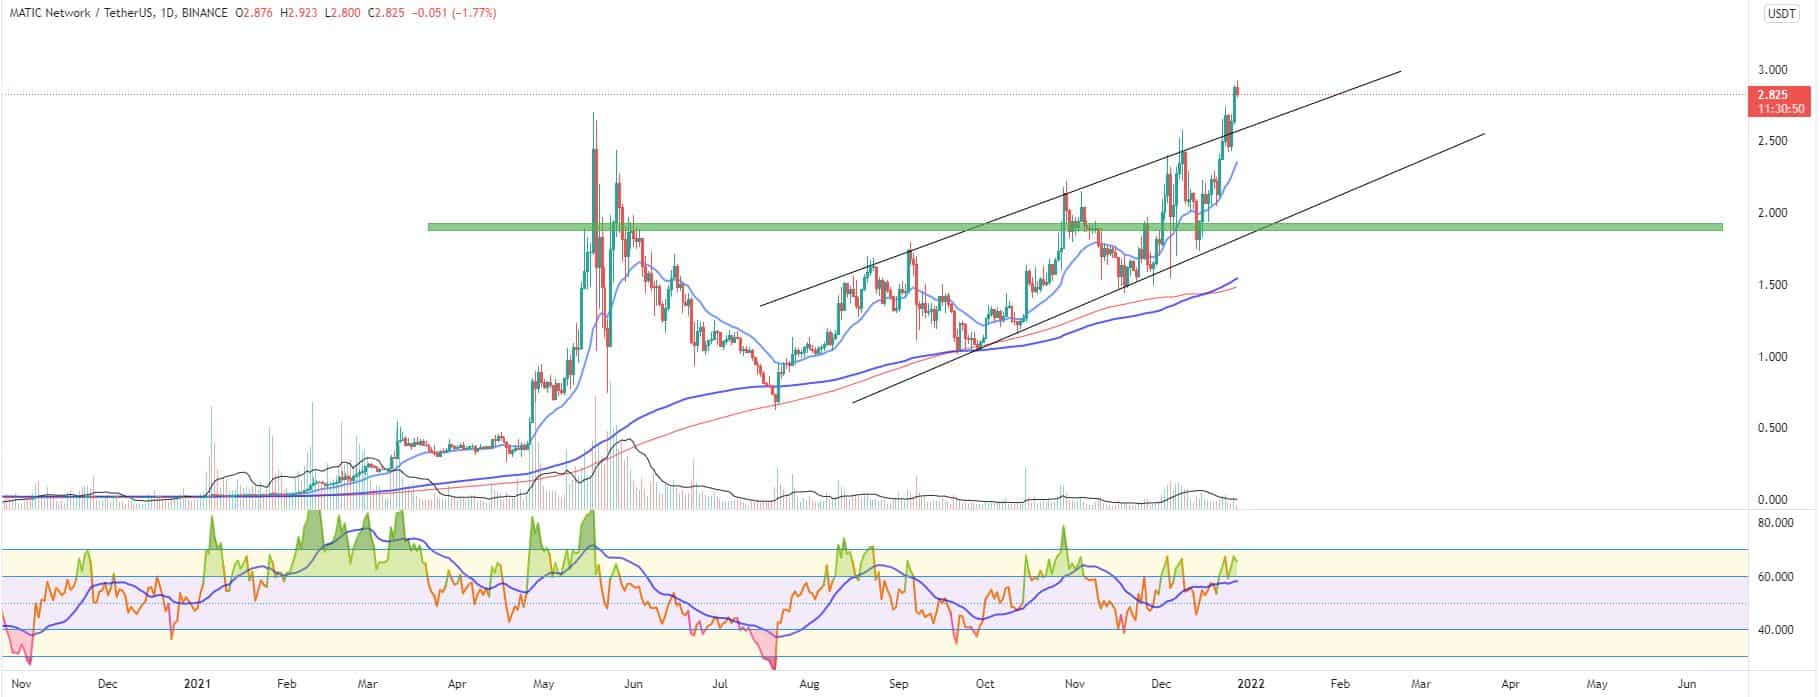
The most popular Ethereum sidechain continued to outperform the rest of the major altcoins. It closed its fourth consecutive week in green, adding 26 percent to its market cap for the period. The MATIC/USDT pair is also 95 percent up since hitting its $1.45 low on November 18. It managed to break above the upper boundary of the uptrend corridor as the more bullish traders turned euphoric.
The altcoin is now building a third peak in the current rally on the daily chart which might result in a short to mid-term price pullback if the market conditions stay the same. It is also trading above its all-time high, now at $2.81
The main reason for the rapid growth of the Polygon ecosystem continues to be its involvement in the blockchain gaming industry combined with the recently announced scalability improvements via the popular zk rollups solutions.
Altcoin of the Week
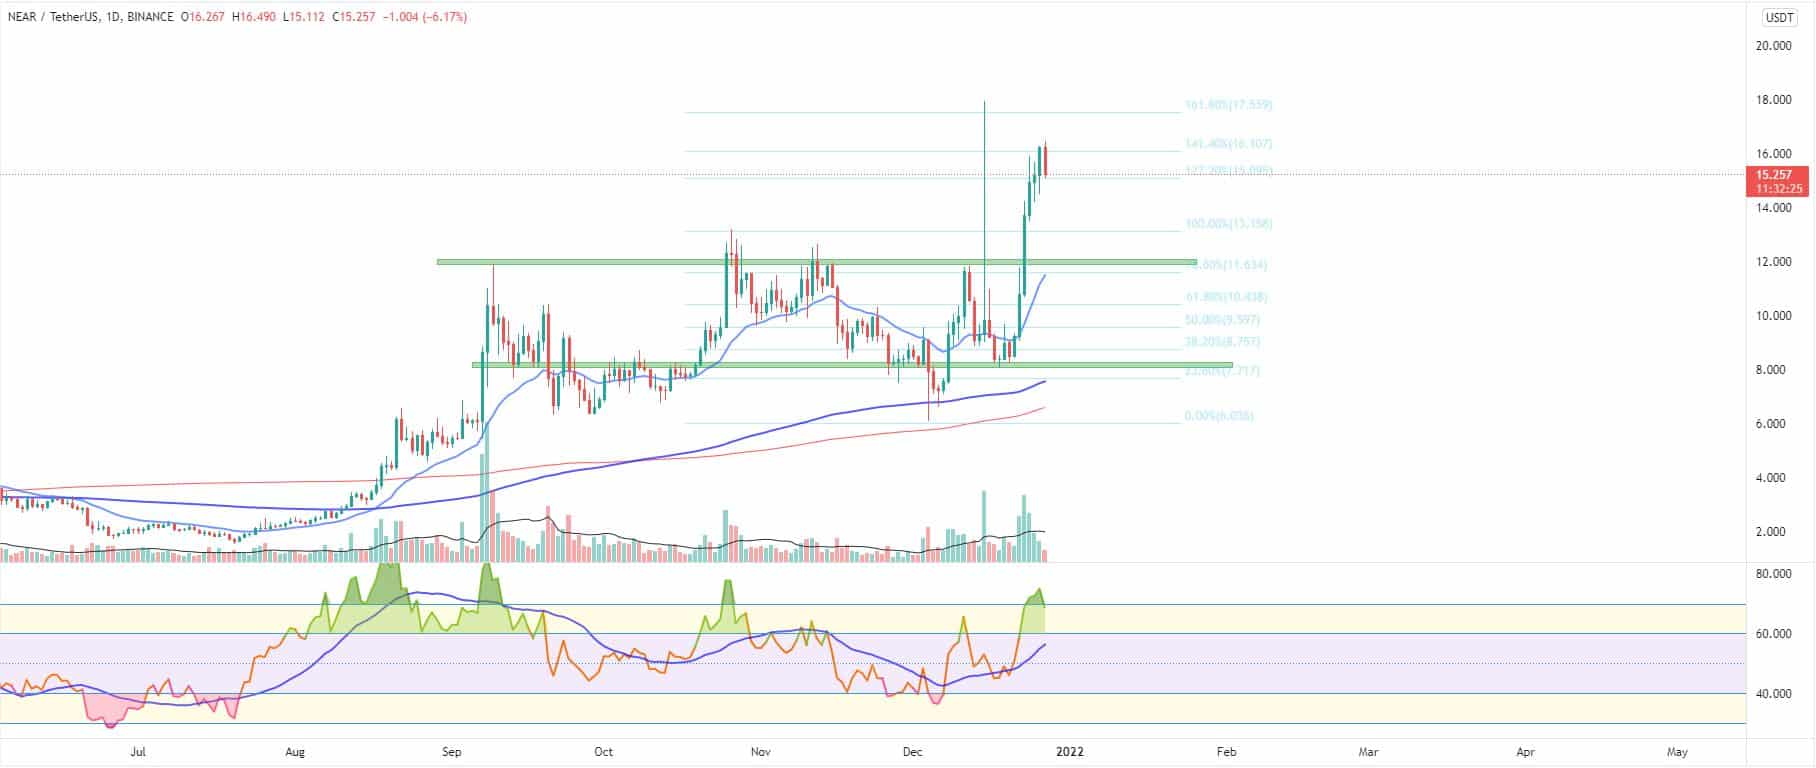
Our Altcoin of the week is the Near Protocol (NEAR). The highly scalable Layer 1 solution was one of the best-performing assets in the Top 100 list during the last seven days. It added 70 percent to its valuation and moved above its highest high on the weekly timeframe.
The coin was now in a de-facto price discovery state since its old peak was a short-lived pump that barely lasted a day.
NEAR climbed up to #22 on CoinGecko with a total market cap of approximately $9.1 billion – just one billion away from the 20th spot. It hit a weekly high of $16.3 on December 26.
The most probable target for the short-term movement of NEAR is to re-visit the zone above $17 where the coin peaked a few weeks ago. It is also where the Fibonacci 161.80% extension level currently lies. Such a move to the upside will allow it to surpass the Algorand (ALGO) protocol.
Solid support at $12.
The NEAR/USDT pair is currently trading at $15.2.
