Bitcoin, ether, major altcoins. Weekly market update, Feb. 13

The cryptocurrency market erased $66 billion from its market cap during the last seven days and now stands at $997 billion. The top 10 coins posted are all in red for the same period, with dogecoin (DOGE) and cardano (ADA) being the worst performers with 11.9 and 10.1% of losses respectively. Bitcoin (BTC) is currently trading at $21,608 while ether (ETH) is at 1,485.
BTC/USD
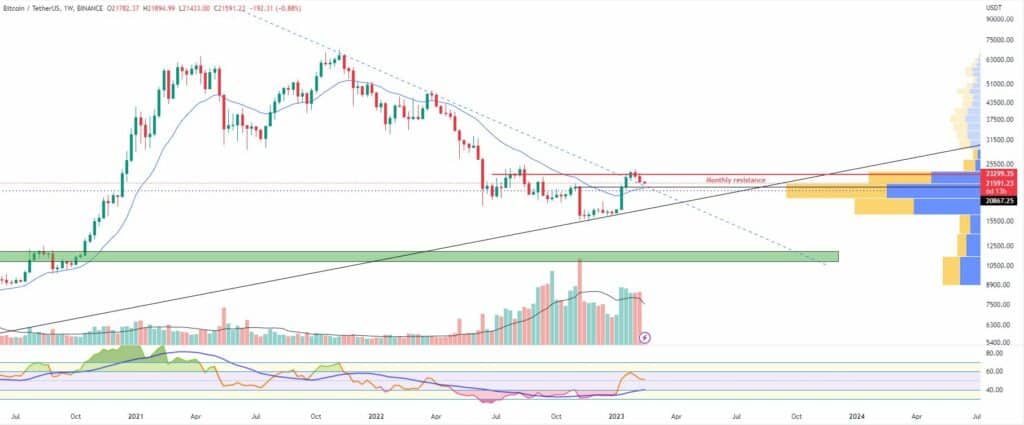
Bitcoin closed the trading day on Sunday, Feb. 5, at $22,927, making it a total of four consecutive days in red since it peaked at $24,240 on Feb. 2. The break above the critical monthly horizontal resistance could not be confirmed. The last high on the 1-month timeframe and the 200-period Exponential Moving Average (EMA) remained the next significant resistance cluster in front of bulls.
All this resulted in a 3.4 drop on a weekly basis and an overall correction in the crypto market.
On Monday, Feb. 6, the BTC/USDT pair fell to $22,750. Traders were starting to look at the lower timeframe support areas, and $22,600 was one of them that was formed after the Jan. 20 breakouts.
The Tuesday session was slightly different. The biggest cryptocurrency jumped up to $23,260 touching the above-mentioned monthly resistance line.
The mid-wee trading on Wednesday came with higher volatility as the price was moving in the narrow $23,400 – $22,700 before closing in the red.
On Thursday, February 9 we saw a continuation of the price pullback with a solid red candle of $21,800, below the short 21-day EMA that was hit for the first time since January 6. Bitcoin erased 5.4% of its value and bulls were starting to look at the $21,000-$20,600 and the big order block around the previous weekly high as a zone that can provide short to mid-term stability.
On the other hand, a clean break above $23,300 on the higher timeframes can be seen as a positive sign from bulls.
The Friday session was a quiet one. Even though the price of BTC touched $21,400 during intraday, it avoided a further decrease.
The weekend of February 11-12 started with a small green candle to $21,860 on Saturday, followed by a continuation of the downtrend on Sunday, although bears were not that active in their attempts to push the price lower.
What we are seeing midday on Monday is another attempt to break below the $21,600 level.
ETH/USD
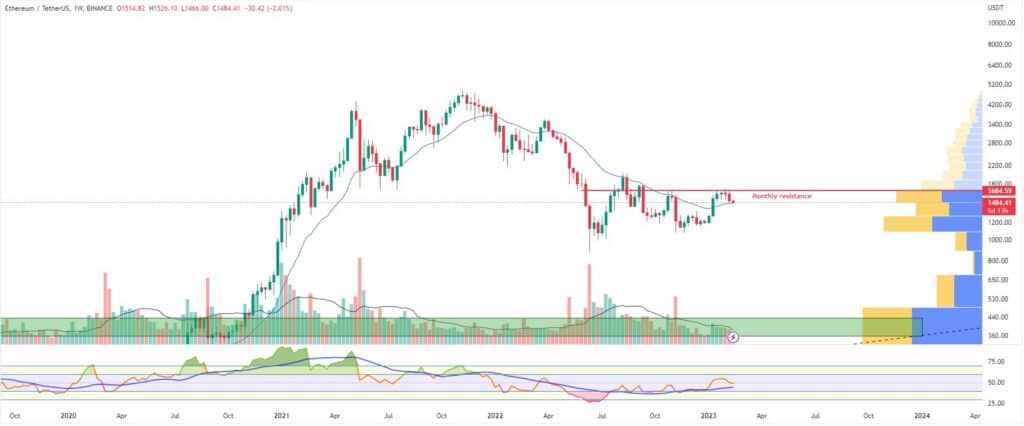
The Ethereum Project ETH ended the week of Jan. 30 – Feb. 5 at $1,630 with a little more than a percent loss. It was, however, marked by high volatility as ether continued to be caught between the monthly timeframe resistance line at $1,690 and the $1,600 level which marked the last weekly high.
On Monday, Feb. 6, the ETH/USDT pair fell further to $1,616 as the Relative Strength Index (RSI) was already reset on the daily timeframe chart.
The Tuesday session brought a new 3.5% increase in the price of ETH, but it remained rangebound. In addition to that it was slowly starting to form a pattern somehow similar to an Ascending triangle or even a Rising Wedge both of which can result in a bearish breakdown if rejected at their upper boundaries.
The third day of the workweek came with an early push to $1,700, which proved unsustainable later in the session.
On Thursday, Feb. 9, the ether fell sharply to $1,543, losing 6.5%. The price broke below the short-EMA and the lower boundary of the above-mentioned figure. Buyers were now looking at $1,500 as their target zone around the starting point of the last rally.
The Friday session saw ETH touch $1,492 during intraday, but as expected the zone proved to be a strong one and the price bounced back quickly on the next day – Saturday, Feb. 11.
The small green candle was followed by another red one on Sunday, as ETH seemed to be in a bearish consolidation mode.
As of the time of writing this market update on Monday, the coin is trading below the $1,500 mark.
Leading Majors
- Cardano (ADA)
It’s been a while since we last wrote about Cardano and its market behavior.
The coin has been in a constant downtrend since September 2021, but a few weeks ago, it finally found its bottom at $0.24 and, since then, has rallied more than 55%.
Since the 1-week chart is usually the most indicative of the price development, we will look at it to see the current status.
The ADA/USDT pair successfully broke above the long-term downtrend line but ran into strong resistance at the former support in the $0.38-$0.4 area. It is also where the 21-period EMA is currently situated.
The next target for bulls above that resistance line will be the last major lower high on the chart – $0.6. Support at $0.32.

Altcoin of the week
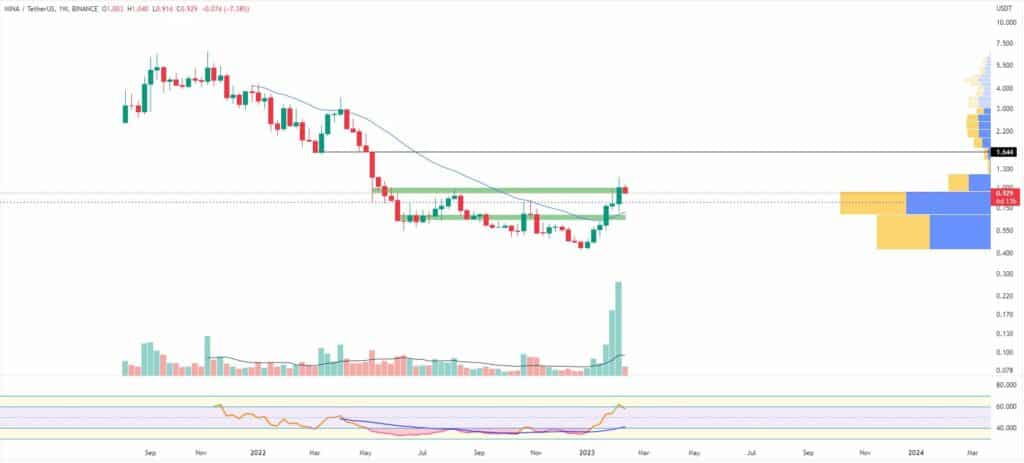
Our altcoin of the week is the Mina Protocol (MINA). Often advertised as the “world’s lightest blockchain protocol,” Mina is creating a brand-new infrastructure that enables developers to build zkApps – smart contracts powered by zero knowledge. The Mina grants program is seen as a way for new projects to kickstart their product and make Mina more appealing to investors due to the increased blockchain and social activity.
The MINA/USDT pair added 26% to its valuation during the last seven days, making it a total of 133% increase since the January 2023 bottom. It is worth noting that the coin lost 93% of its market cap during the bear market of 2022.
Mina has been struggling with the $0.65-$0.7 resistance area for quite some time but, a few weeks ago, managed to surpass it while also breaking above the important short-term 21-period EMA on the weekly timeframe chart. It also broke above the next high on the chart – $1 and is now looking for proper consolidation around the previous resistance zone.
Bulls will be aiming at $1.6 as their next target up.
MINA is currently ranked at #55 on CoinGecko, with a total market cap of approximately $923 million.