Bitcoin, ether, major altcoins. Weekly market update, Feb. 6

The cryptocurrency market added $8 billion to its market cap during the last seven days and now stands at $1,060 billion. The top 10 coins posted mixed results for the same period with OKB (OKB) and Binance Coin (BNB) adding 10.2 and 2.7% to their market values respectively while XRP (XRP) lost 4.2%. Bitcoin (BTC) is currently trading at $22,760 while ether (ETH) is at 1,623.
BTC/USD
Bitcoin closed the trading day on Sunday, January 29 at $23,783 and moved out of the 8-day range after adding 4.75% to its valuation during the week of January 23-29. The coin successfully surpassed the monthly horizontal resistance 2 days before the end of January but was unable to break above the 200-day EMA.
The BTC/USDT pair, however, could not keep up with the momentum and at the beginning of the new trading period erased all gains by falling down to $22,820, which resulted in a 4% drop.
The Tuesday session on January 31 was a slow one as the markets were anxiously waiting for the United States Federal Reserve Open Market Committee (FOMC) meeting and the federal rate decision on Wednesday. The 24-hour trading volumes fell below the average for the last 14 days.
The leading cryptocurrency drew a small green candle on the daily chart and avoided further decreases.
Bitcoin ended the month of January 40% higher and fully engulfed the last four candles on the 1-month chart.
The mid-week trading on Wednesday was marked by extreme volatility across the entire cryptocurrency market and the legacy financial markets.
The FED announced a 25 bps interest rate hike, fully in synch with the expectations. The risk asset markets rallied on the news. BTC jumped 2.7%.
On Thursday, the coin hit a 170-day high at $24,250 during intraday, but the momentum was not on the buyers’ side anymore which resulted in a small red candle at the end of the session.
The selloff continued during the next three days. On Friday, bitcoin remained relatively flat, but still bears were in full control.
The weekend of February 4-5 started with an attempt from sellers to break below the former monthly horizontal resistance on Saturday.
Then on Sunday, we saw a red wave across the entire market with BTC erasing 1.5%.
What we are seeing midday on Monday is a continuation of the price pullback.

ETH/USD
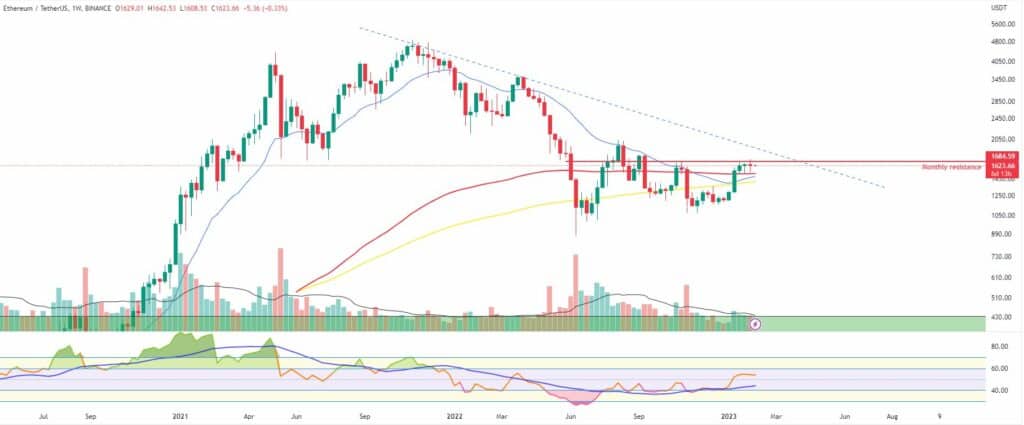
The Ethereum Project token ETH added less than a percent during the January 23-29 trading making it a total of 37% for the 4-week period. The coin hit $1,646 on Sunday, January 29, and was still trading in the narrow range right below the monthly resistance line.
The ether started the new week on Monday with a sudden drop to the zone right below $1,540, touching the short 21-day EMA on the daily timeframe chart. The move resulted in a 5.2% decrease in its valuation.
On Tuesday, January 31, the ETH/USDT pair remained stable in the area near $1,580 ending the first month of the year with a 32%increase.
As mentioned above in our BTC analysis, the markets reacted positively to the announced 25 bps interest rate hike on Wednesday. ETH was no exception jumping 3.5% up from the 21-day EMA.
Still, the coin remained caught in the tight range between the 200-day EMA and the monthly resistance since January 15.
Things changed on Thursday, February 2 when the ether climbed all the way up to $1,717 in the morning or 4.5% higher while also breaking the monthly horizontal resistance.
However, the strong bullish move was not sustainable and the price of ETH quickly came back down to the above-mentioned range.
The Friday session brought was a better one for bulls and they made one step higher with less than a percent of increase.
The first day of the weekend was marked by yet another attempt to surpass the long-term resistance line, which once again proved to be too fortified to be broken without a proper consolidation.
On Sunday, we saw a significant 2.5% correction to $1,627.
Leading Majors
- Binance Coin (BNB)
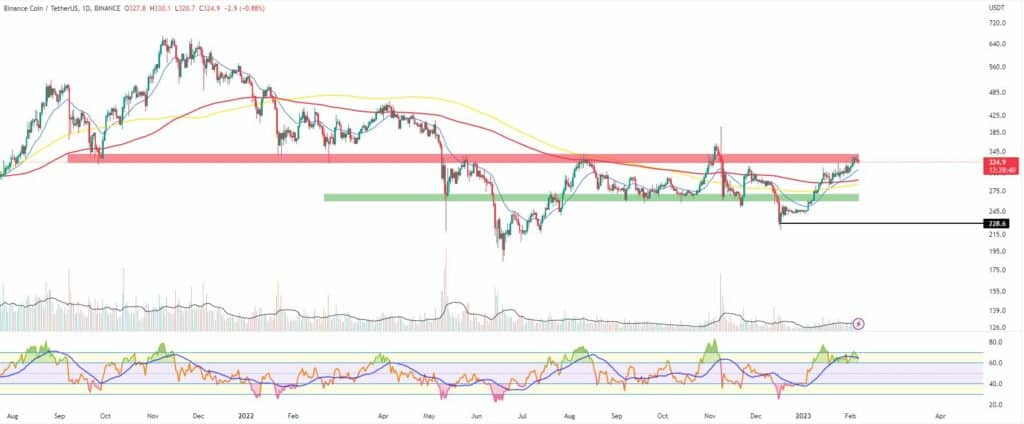
BNB was among the biggest gainer on the Top 10 coins list during the last seven days.
The native token of the Binance exchange and the Smart chain has been under immense pressure in the fallout of the FTX collapse saga but managed to bounce back stronger from the November/December 2022 selloff.
The coin lost the $260 support level but was able to reverse the downtrend at $220-$240 and since then has added 32% to its market cap.
During last week’s trading, it grew by 3% after suffering a rejection at the $340 mark for the 5th time in the last seven months.
The BNB/USDT pair, however, is still trading above the 21-period EMA and the long-term diagonal resistance and a successful breakout will surely see its price rally toward the next high on the weekly chart – $450.
Support at the former stability zone – $260-$270.
Altcoin of the week
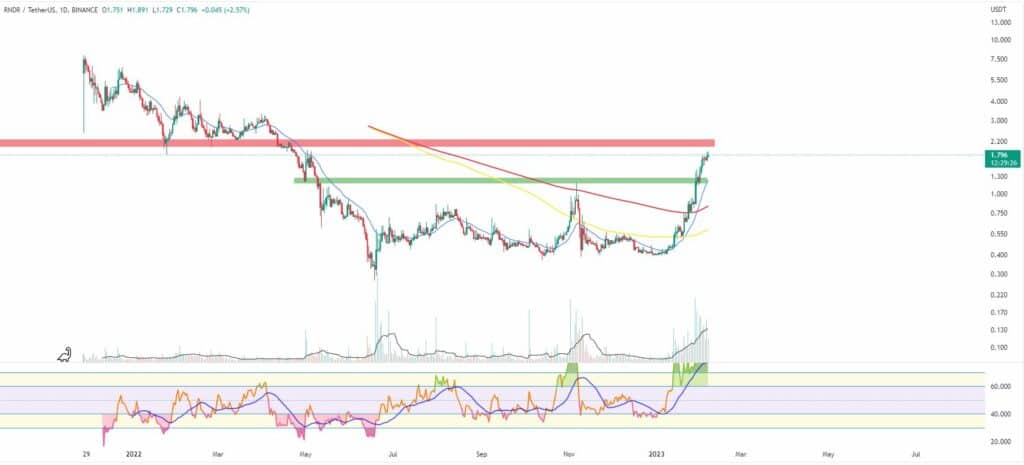
Our Altcoin of the week is Render (RNDR). This popular metaverse project was one of the best-performing assets on the Top 100 list last week, adding 42% to its valuation for the period.
The Render network is a protocol aimed to be the meeting place of users who are in need to perform render jobs but don’t have the hardware with people who are eager to “lend” their GPUs to process the rending job. In a few words – GPU cloud rendering.
The RNDR/USDT pair increased by 36% making it a total of 324% since bouncing back from the $0.4 support back in early January 2023. The token broke above the last two lower highs and is now trading above the 21-period EMA on the weekly timeframe chart and close to the $1.7 mark for the first time since April 2022.
The next resistance zone is situated right above $2 while bulls can expect the $1.2 and $0.9 supports to provide short to mid-term stability.
The RNDR token is currently ranked at #91 on CoinGecko with a total market cap of approximately $506 million.