Bitcoin, ether, major altcoins. Weekly market update Jan. 30

The cryptocurrency market added $1 billion to its market cap during the last seven days and now stands at $1,052 billion. The top 10 coins were mostly flat for the same period, with Polygon (MATIC) being the exception with 12.1. percent of gains. Bitcoin (BTC) is currently trading at $23,120 while ether (ETH) is at 1,585.
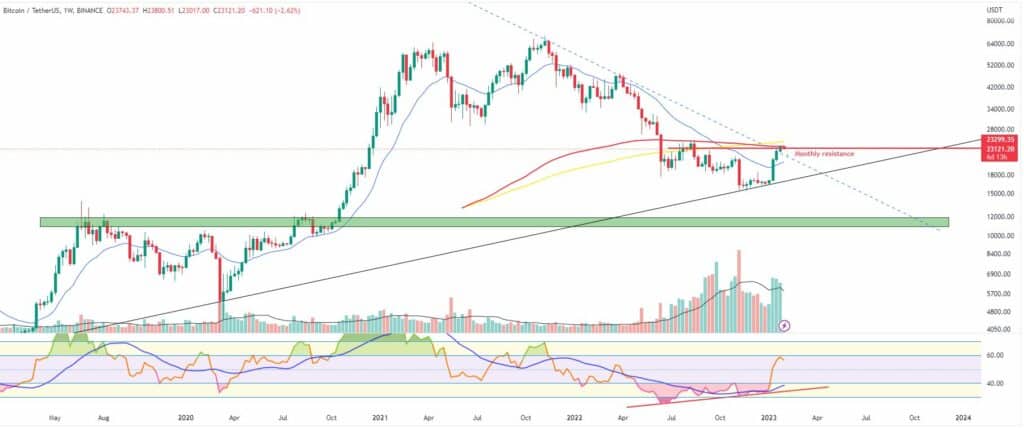
BTC/USD
Bitcoin closed the trading week of January 16-22 at $22,630 after a flat Sunday session. The coin registered a solid 8 percent increase for the seven-day period making it a total of 45 percent since the November 2022 bottom.
On Monday, January 23 the new week started with low volatility and a small green candle to $22,900. BTC continued to trade above both the 21-period EMA on the weekly timeframe and the long-term diagonal resistance. Still, the $23,300 monthly resistance and the next lower high on the chart – $24,300 remained the following two significant obstacles in front of buyers.
Things did not change much on Tuesday as neither bulls nor bears were able to take control of the price action. The biggest cryptocurrency erased all gains from the previous session and ended the day at $22,650.
The mid-week trading on Wednesday was marked by the return of volatility. The BTC/USDT pair was trading in the $23,800-$22,300 range before stopping at $23,050 in the evening.
The coin remained flat on Thursday after failing to break above the mentioned monthly resistance. Bulls were ready for the next leg up while bears continued to insist the horizontal rejection marked the local top.
The trading session on Friday was highly volatile as BTC was moving up and down the $22,600-$23,500 range before forming a small green candle at the daily candle close. The price action was similar to the one from mid-January, right before the coin spiked to the upside.
The weekend of January 28-29 came with another slow trading day on Saturday. It looked like traders were more active in the altcoin market while waiting for bitcoin to consolidate for the next leg up.
Then on Sunday it suddenly jumped past the monthly resistance, stopping at $23,740 or 3 percent higher.
What we are seeing midday on Monday is a significant pullback as bears are trying to drive the price of BTC below the $23,000 mark.
Trading volumes fell below the average values while the Relative Strength Index (RSI) remained overbought – signs of potential exhaustion of the rally.
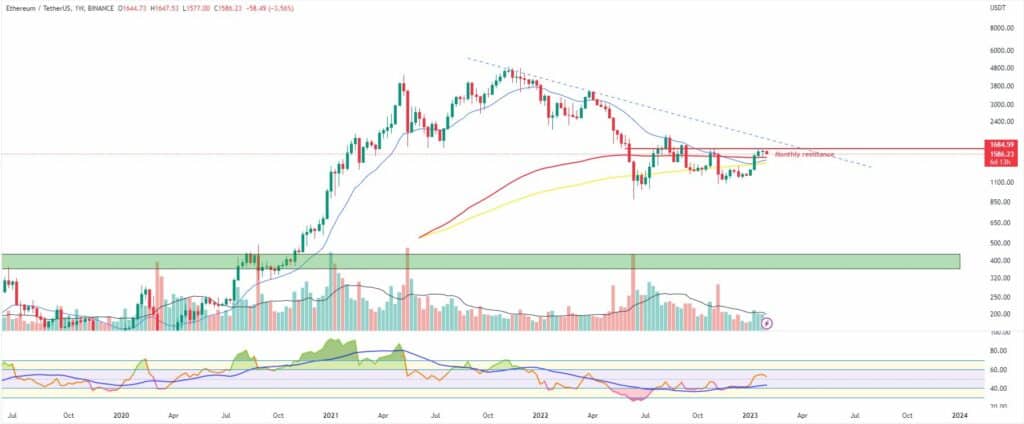
ETH/USD
The Ethereum Project token ETH ended the week of January 16-22 with a 5 percent increase. The coin climbed above the $1,590 high and confirmed its presence above the 200-period EMA.
The next major obstacles in front of bulls were the monthly horizontal resistance – at $1,685 and the long-term diagonal resistance line near the $1,800 mark.
On Monday, January 23 the ether remained flat, right above the mentioned $1,590 high, and with decreasing daily trading volumes.
Bears were ready and waiting, and on the next day, they managed to push the price down 5 percent. The leading altcoin continued to be in an obvious consolidation, but too much time spent below the following resistance line could mean a lack of bullish momentum.
The price bounced back up from the meeting point of the 200 and 21 EMAs on the daily chart on Wednesday. The move resulted in a 4 percent jump that saw bulls re-capture the $1,600 level.
On Thursday, the ETH/USDT pair lost some ground, but bulls were able to avoid big declines and kept the majority of the gains from the previous session.
The bear pressure was increasing, and ETH fell down to $1,555 on Friday before recovering in the evening and eventually closing the daily candle flat.
Nevertheless, the first day of the weekend found the ether dropping 2 percent, which resulted in losing the $1,600 level.
The 8-day-long consolidation ended on Sunday when the price of ETH suddenly spiked and reached $1,644.
As of the time of writing this market update, the price is hovering around the $1,590 mark.
Leading Majors
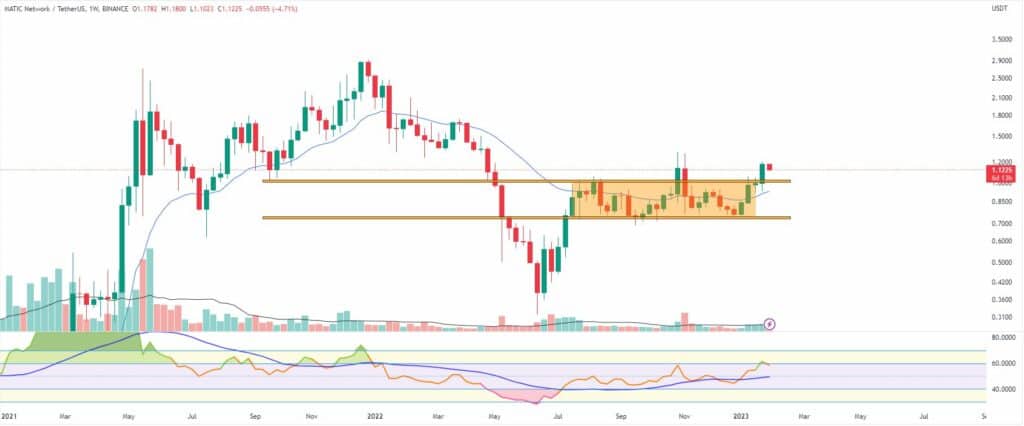
- Polygon (MATIC)
The native token of the popular Ethereum sidechain solution and Layer 2 protocol Polygon broke out of its 6-month-old range after a solid seven-day period.
The MATIC/USDT pair added 18 percent to its market cap during the previous week, making it a total of 55 percent since rebounding from the range low 3 weeks ago.
It is not the first time the price has broken out of the $0.75-$1.02 range. We saw a similar move back in November 2022, but the price deviation then turned out to be nothing but a failed breakout (or fakeout). The rising trading volumes and the overall bullish momentum in the crypto markets give MATIC bulls hope that they will finally see it rally toward the next major resistance on the chart – $1,35.
The top of the old range can be turned into solid mid-term support.
Altcoin of the week
Our Altcoin of the week is GMX (GMX). This cryptocurrency coin is one of the two used on the relatively new decentralized perpetual exchange GMX.IO (the other one being a token called GLP) offering multiple benefits to traders and holders. The GMX/USDT pair added 22 percent to its valuation for the last seven days and is more or less in a price exploration state after making a new all-time high daily and the weekly candle closes.
The overall interest in the GMX token grew recently mainly due to the rising popularity of the Arbitrum ecosystem, where the exchange is hosted, and the high staking APR that the GMX token provides to holders. The rising trading volumes and skyrocketing trading fees collected on the exchange give additional reasons for traders and investors to look at GMX.
The coin is currently ranked at #90 with a total market cap of approximately $490 million (fully diluted valuation at $828 million)
The zone around the $60 mark where the last highest high is on the daily timeframe chart can act as potential support.