Bitcoin, Ether, Major Altcoins – Weekly Market Update July 19, 2021

The total crypto market cap lost $127 billion from its value for the last seven days and now stands at $1,273 billion. The top 10 coins were all in red for the same time period with Polkadot (DOT) and Dogecoin (DOGE) being the worst performers with 21.6 and 16.8 percent of losses respectively. Bitcoin (BTC) is at $31,206 at the time of writing. Ether (ETH) is currently trading at $1,860.
BTC/USD
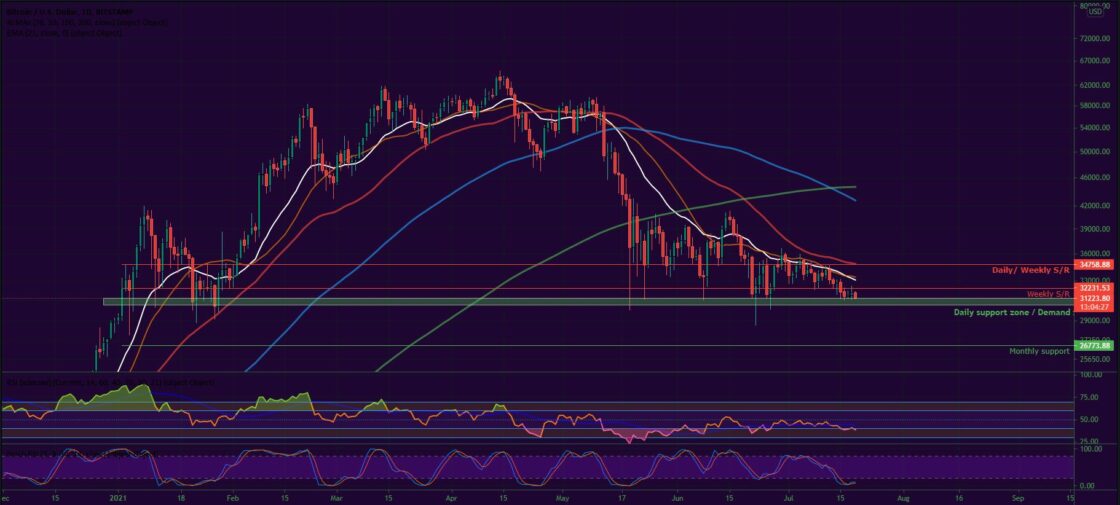
Buyers pushed the price of BTC up to the multi-timeframe resistance at $34,700 on Sunday, July 11 in an attempt to save the weekly candle which was about to close below that level for the first time since January. However, they were rejected right there which caused bitcoin to end the week at $34,300 with a 2.8 percent loss.
On Monday, the leading cryptocurrency failed to break above the 21-period EMA on the daily timeframe and was forced to retrace down to $33,000, trading at $32,600 during intraday. The move resulted in a 3.4 percent pullback.
The Tuesday session was no different and the BTC/USDT pair continued to slide forming the second consecutive red candle on the daily chart by touching $32,600. What is worth noting is that bears managed to push the price down to the next weekly support zone around $32,200 – the neckline of the big head and shoulders pattern on the weekly timeframe.
The mid-week session on Wednesday came with a sharp 3.8 percent drop to $31,600 in the early hours of trading. The selling activity was quickly absorbed and BTC was able to recover to $32,800 at the candle close.
On Thursday, July 15, however, we witnessed how bears renewed the selling pressure and bitcoin once again lost the mentioned support line falling further to $31,800. The price of the coin revisited $31,000 during intraday for the first time since June 26.
The Friday session was no different and the biggest cryptocurrency continued to move South, this time reaching $31,368 thus entering the extremely important demand zone right above $30,000.
The weekend of July 17-18 started with a relatively calm day on Saturday during which the coin managed to stabilize in the above-mentioned area, staying flat.
Then on Sunday, it climbed up to $31,767 with a short green candle.
What we are seeing on Monday morning is a continuation of the downtrend.

ETH/USD
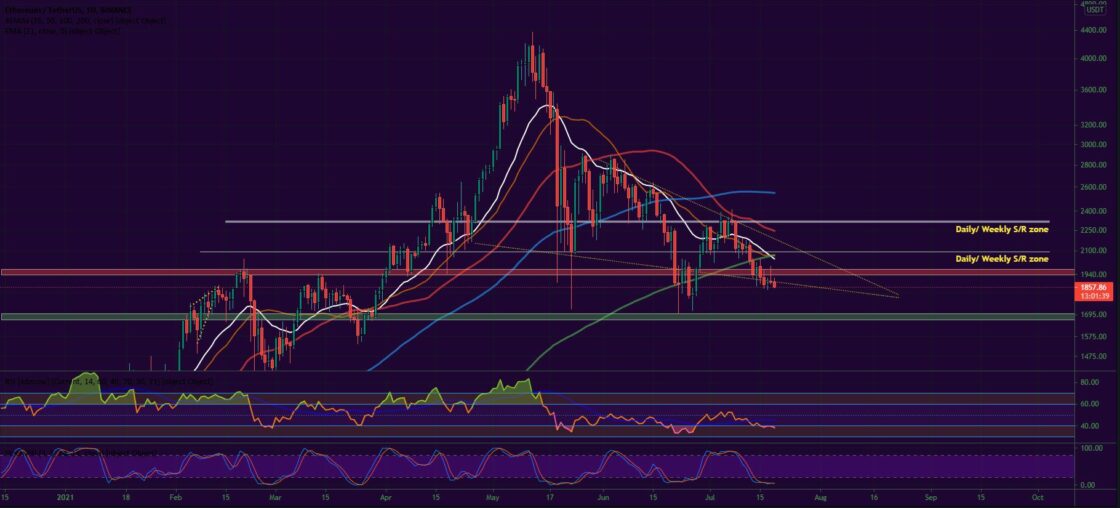
The Ethereum Project token ETH regained positions near $2,140 on Sunday, July 11, but failed to close the weekly candle above the 21-period EMA (which was then situated around $2,180). It lost 8.2 percent on a seven-day basis, which drove the price down below the 21-period EMA – a strong bearish sign.
On Monday, the ether was rejected at the short-term EMA on Daily and retraced down to $2,030, a 5.1 percent correction.
The Tuesday session was no different and the major altcoin fell further to $1,940, closing below the $2,000 mark for the first time since June 28.
The third day of the workweek saw ETH hitting another monthly low. First, it touched $1,867 in the morning, then recovered to $1,991 in the latter part of the session. The selling pressure was there, with strong momentum, but it is also worth noting that on the weekly chart, the ETH/USDT pair is in a Falling Wedge reversal formation and the price just hit its lower boundary.
On Thursday, July 15, ETH erased 3.5 percent to perfectly hit the lower part of the mentioned trading pattern. Some traders were already suggesting the downtrend is exhausted and the on-chain metrics are in favor of bulls that expect a short-term reversal.
The Friday session though proved them wrong. The ether continued to lose ground, this time touching $1,873.
The first day of the weekend came with a low volatility session, during which the leading altcoin remained around the price reached during the last 24 hours.
On Sunday, buyers made a short-lived reversal attempt by pushing the price up to $2,000 in the morning, but the rally was fully retraced later in the day.
As of the time of writing, the coin is trading slightly lower – at $1,860.

Leading Majors
- Litecoin (LTC)
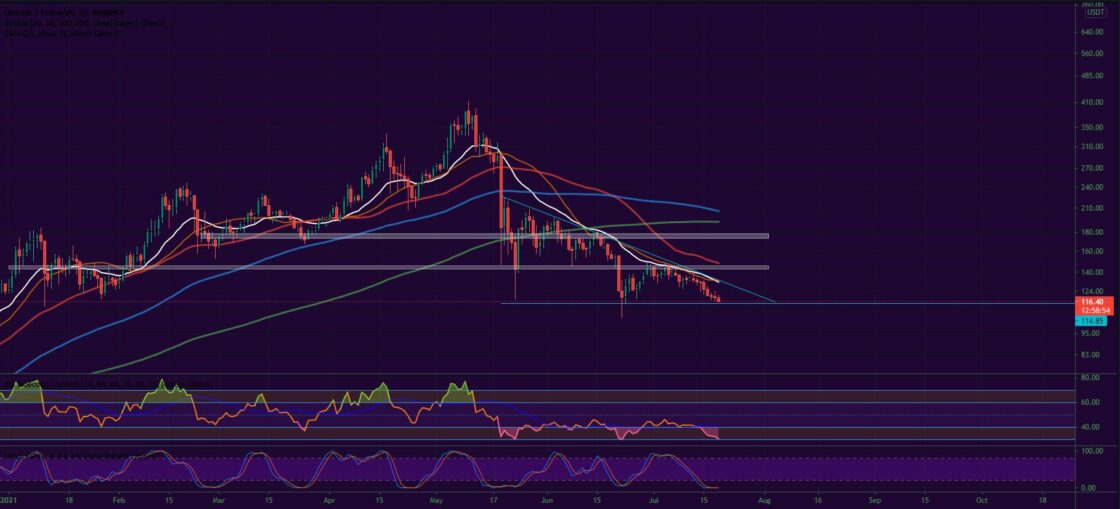
One of the oldest cryptocurrencies out there did not increase in price during the last week, but still managed to stabilize around its previous horizontal support.
The coin was last rejected in the zone near $170 where few important indicators met – the 21-day EMA, the horizontal resistance, and the lower boundary of the bearish pennant. This resulted in a heavy drop to the next support at $145 and then another sharp decline to May low of $117.
What is next for the LTC/USDT pair is to stabilize above the mentioned support level and attempt a break above the 21-day EMA and the diagonal resistance line above $135.

Altcoin of the Week
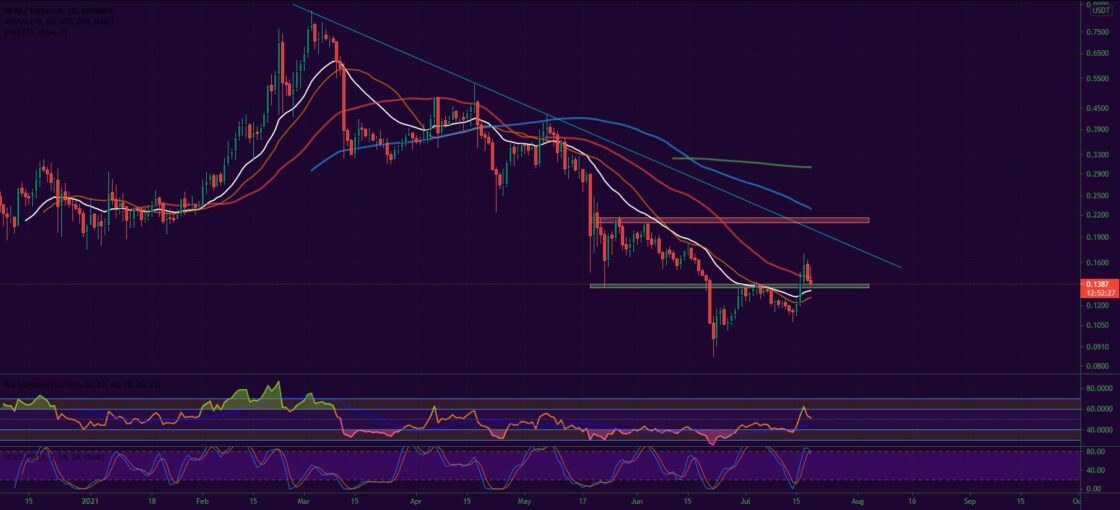
Our Altcoin of the week is NEM (XEM). The ecosystem of blockchain platforms, which is also one of the most popular legacy coins from the last bull run, added 15 percent to its value for the seven-day period.
The main reason for the recent surge in the price of NEM is the announcement from the Government of Colombia that its Ministry of Information Technology and Communications will collaborate with the software development company Peersyst Technology to experiment with blockchain in series of government projects. The company itself uses Symbol, NEM’s enterprise-grade blockchain solution.
The move helped the coin climbed up to #65 on CoinGecko’s Top 100 list with a market capitalization of approximately $1.27 billion.
The XEM/USDT pair peaked at $0.171 on Saturday, July 17 and as of the time of writing is trading at $0.138.


