Bitcoin, Ether, Major Altcoins – Weekly Market Update July 26, 2021

The total crypto market cap added $265 billion to its value for the last seven-days and now stands at $1,536 billion. The top 10 coins were all in green for the same time period with ether (ETH) and bitcoin (BTC) leading the pack with 23 and 20.1 percent of gains respectively. The biggest cryptocurrency is trading at $38,550 while the leading altcoin is at $2,350.
BTC/USD
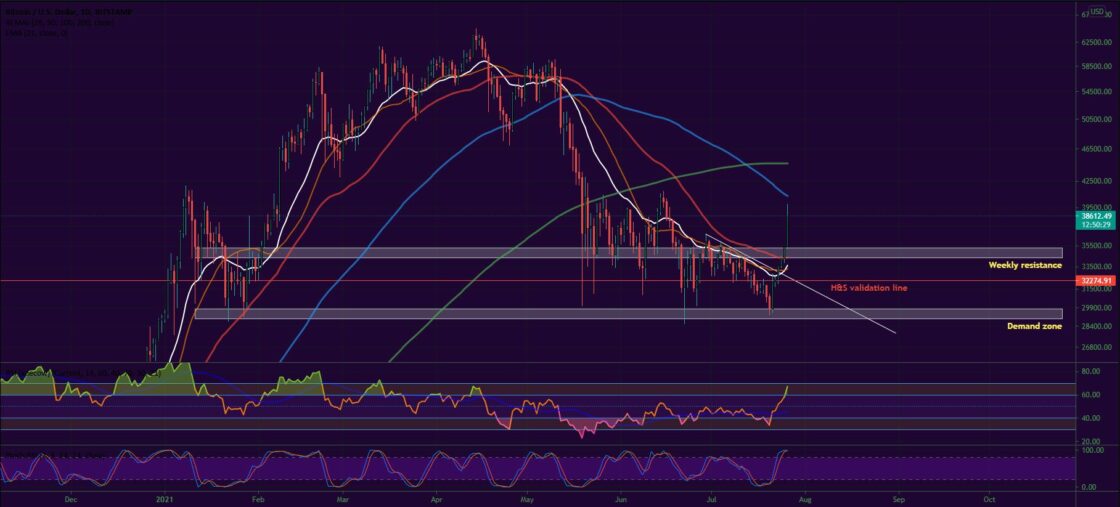
Bitcoin was using the zone above $31,000 as horizontal support for quite some time. On Sunday, July 18, it jumped up from that level to end the week at $31,700, but still failed to move above the $32,300 mark – the neckline of the big head and shoulders pattern on the weekly timeframe. BTC lost that important line, confirming the bearish pattern and erasing 7-percent of its value for the period.
On Monday, the coin dropped to $30,800, closing below $31,00 for the first time since January 27. The entire cryptocurrency market was bleeding with a lot of coins in the Top 100 registering double-digit losses.
The situation worsened on the next day when bitcoin fell further to $29,800 as many analysts were already pointing to $25,000 as the next zone of support followed by the previous bull market’s all-time high at $19,400.
The third day of the workweek was slightly better for buyers and the leading cryptocurrency climbed to $32,150 after rebounding from the mentioned lows, which resulted in a 7.7 percent increase. BTC was rejected at the 21-day EMA on the daily chart.
On Thursday, July 22, it consolidated in that area but was once again unable to surpass the moving average. Still, the coin stabilized its price around the Head and Shoulders break point thus keeping the bulls’ hopes alive.
The Friday session came with a continuation of the upside reversal and 4 percent price increase that pushed the price of BTC up to $33,630. It finally broke the 21-day EMA and the short-term diagonal downtrend line.
The weekend of July 24-25 started with a move towards the next major resistance zone around $35,000. The BTC/USDT pair closed the day at $34,330 as more and more buyers joined the market claiming the crypto market bottom was finally in.
Then on Sunday, the most popular cryptocurrency registered its fifth day in green since it last visited the sub-$30,000 area. Bitcoin ended the seven-day period at $35,300 completely engulfing the last two candles on the weekly chart.
What we are seeing on Monday morning is a solid uptrend in an attempt from buyers to break the $40,000 mark and the last visited high at $43,330.
ETH/USD
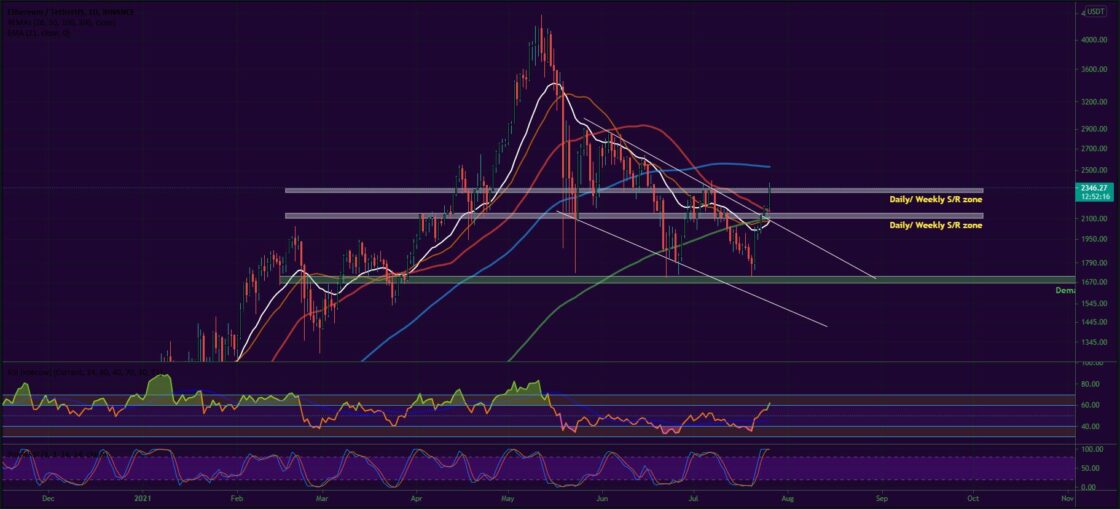
The Ethereum Project token ETH continued to be caught in a downtrend corridor, making lower highs and lower lows on the daily chart. On Sunday, July 18 it was rejected at the $2,000 mark – close to the 21-day EMA and fell down to $1,893 fully retracing its daily gains. The coin was 11.4 percent down for the seven-day period.
Looking at the weekly chart the ether is in quite a bad shape two weeks before the major network upgrade – the London hard fork, which is scheduled for August 4. The ETH/USDT pair moved below the stable support zone that was established in the $1,940-$1,980 range and broke below the Falling Wedge pattern, invalidating it.
On Monday, bears continued to be in charge pushing the price down by 3 more percent to $1,816.
The trading session on Tuesday was no different and the leading altcoin formed a candle to $1,780 – its lowest daily close since March 29. It is worth mentioning that during intraday, the ETH token was trading even lower – at $1,703 before bulls stepped in.
On Wednesday, July 21, we saw the so-called “relief bounce” as sell orders were absorbed to open space for an 11 percent increase session to $1,990.
On Thursday, the ETH/USDT remained relatively stable trading in a narrow range below the 21-day EMA.
The last session of the workweek came with a 4.7 percent increase and a third-straight green candle on the daily chart as the ETH token hit the upper boundary of the downtrend corridor near $2,118 or right next to the next major multi-timeframe resistance area.
The first day of the weekend was no different as bulls were in total control of the market. The ether climbed further to $2,185. It stabilized in that area on Sunday, July 25, and closed the weekly candle above both the horizontal resistance and the 21-period EMA while also breaking out of the falling wedge formation.
On Monday, the ETH/USDT pair is trading significantly higher – at $2,350.
Leading Majors
- Polkadot (DOT)
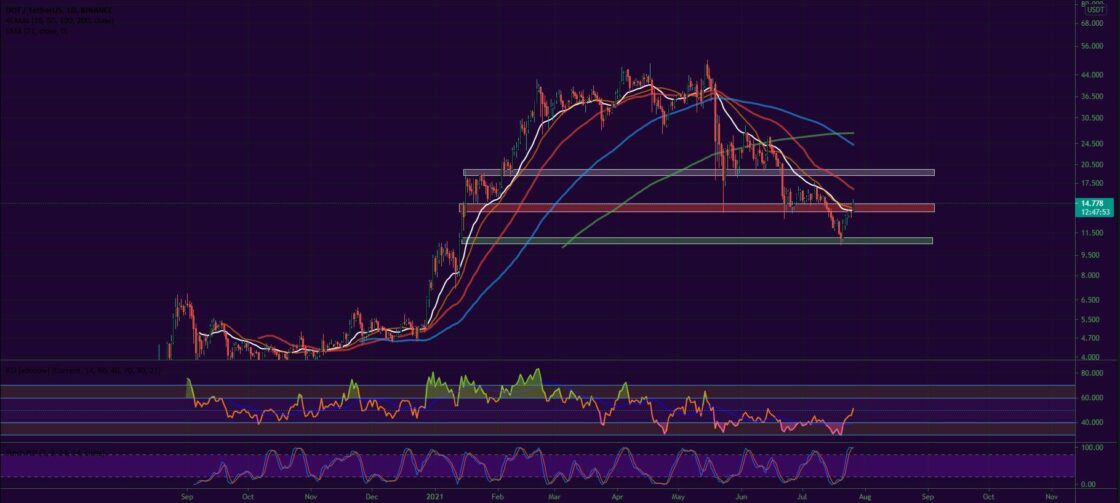
Previously a Top 3 contender, Polkadot was one of the worst-performing assets on the list, heavily hit by the recent price correction. The DOT/USDT pair bottomed at $10.3 on July 20 and is on its way up ever since then, adding 43 percent to its value (as of the time of writing).
The coin is currently trading around $14.7 right into the next resistance zone that is situated in the $14.5-$16 range around the previous demand zone.
Down, we see $10 as the next logical level of support given the fact bulls already found stability around the January 2021 high.
Altcoin of the Week
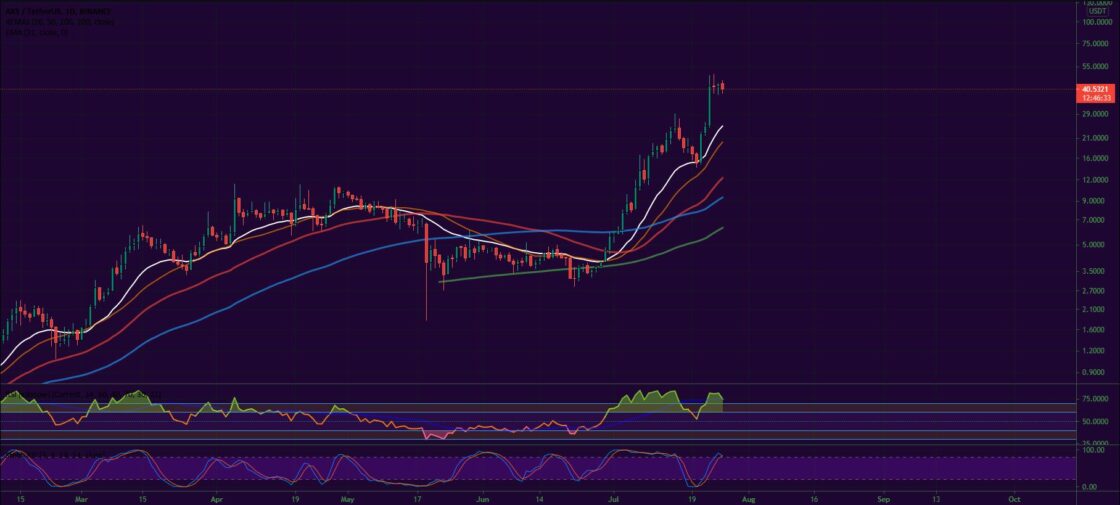
Our Altcoin of the week is Axie Infinity (AXS). This cryptocurrency project focuses on blockchain-enabled gaming that enables players to earn while developing the Axie virtual world ecosystem. It is literally the most traded token for the last few weeks with a 24-hour trading volume record of $7 billion during the weekend of July 24-25. The AXS/USDT pair added 133 percent to its value for the last seven days and is 2,182 percent up since its May low.
Axie moved up to #50 on CoinGecko’s Top 100 chart with a total market cap of approximately $2.28 billion.
The coin peaked at $49.5 on Saturday, July 24, and is currently trading at $40.8 against USDT on Binance.