Bitcoin, Ether, Major Altcoins – Weekly Market Update June 14, 2021

The total crypto market cap added $17 billion to its value for the last seven days and now stands at $1,687 billion. The top 10 coins were mostly in red for the same time period with some of them posting double-digit losses. Bitcoin (BTC) was the only gainer with a 9.5 percent of increase. It is currently trading at $39,180, ether (ETH) is at $2,475.
BTC/USD
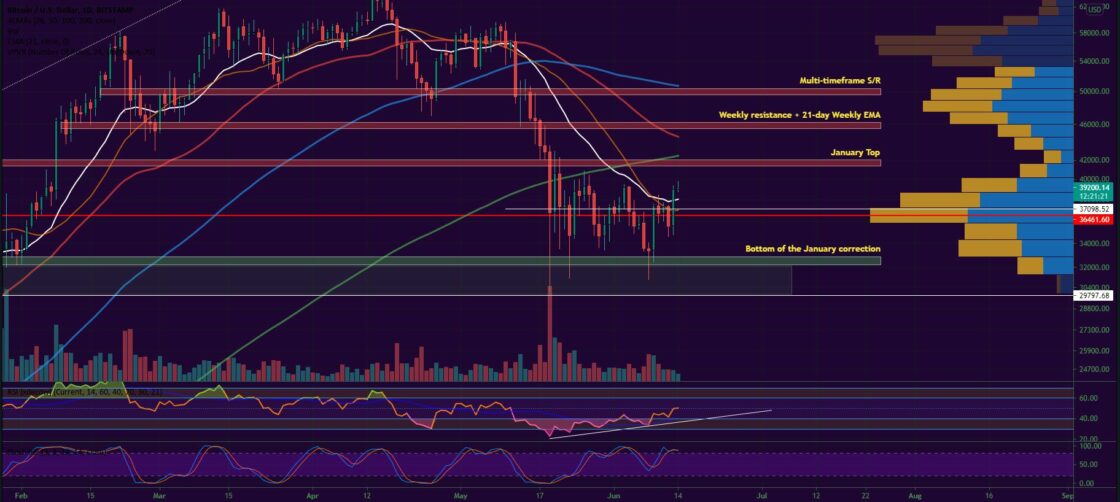
The price of Bitcoin remained almost flat around the $36,000 level on Sunday, June 6, with no drastic changes in the trading direction. Bulls were able to keep it floating above the lower boundary of the triangle (bearish pennant formation) on the 4-hour chart. The coin ended the week with less than a percent of a change for the period.
On Monday, the BTC/USDT pair finally broke the mentioned technical formation and registered a 6.2 percent loss. The coin was trading $36,800 in the early hours of the session but collapsed in the second part of the day.
The selloff continued on Tuesday and the biggest cryptocurrency once again penetrated the sub-$32k support zone. It was trading as low as $31,000 before partially recovering in the evening, eventually closing with a small red candle to $33,350.
The sell orders were quickly absorbed and on Wednesday BTC skyrocketed by 12 percent, engulfing the last 4 candles on the daily chart. It surpassed the important local resistance at $37,00 and ended the session at $37,300.
On Thursday, June 10, the BTC/USDT pair attempted to break the 21-day EMA but bulls were rejected there which triggered a pullback to $36,700.
The $36,500-$37,000 are was the one with the strongest trading activity and without a doubt the critical zone for bulls to preserve the chance for an upside reversal.
Bulls pushed the price up to $37,300 on Friday but lacked the momentum to initiate a price rally.
The first day of the weekend came with a 4.8 percent drop to $35,500, but we could now clearly see a bullish divergence signal being formed on the RSI indicator on the daily timeframe, which usually indicates exhaustion of the respective trend.
On Sunday, bitcoin skyrocketed past the $37,000 resistance and added 9.5 percent to its value on the news that Tesla has only sold 10 percent of its BTC and plans to re-add it as a payment method.
ETH/USD
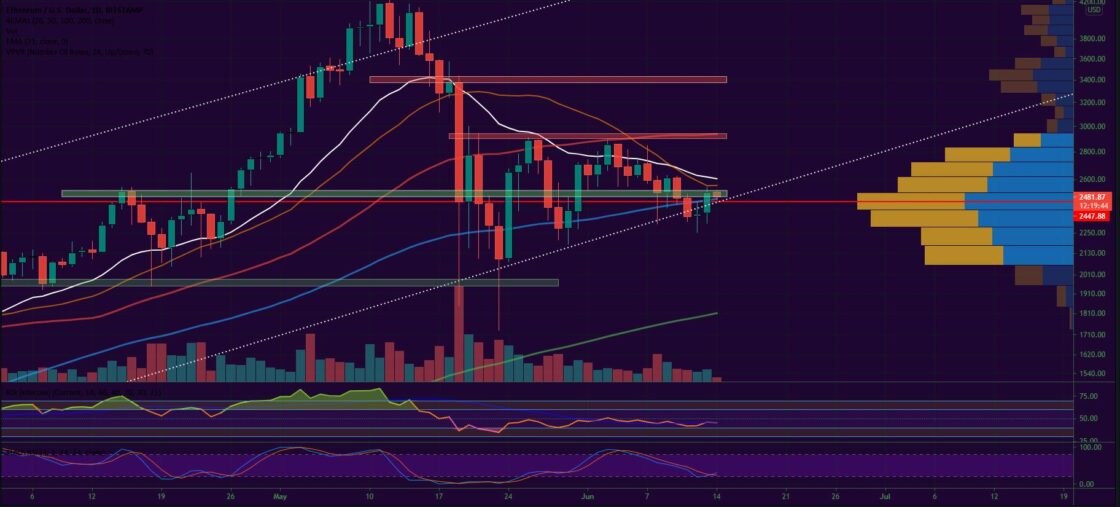
The Ethereum Project token was still trading below the 21-period EMA on the daily chart on Sunday, June 6. It was unable to keep the price above that indicator for a third consecutive session after bulls were rejected near the $2,900 horizontal resistance on June 3.
The week was concluded with a 13.4 percent of growth.
On Monday, the ether was moving up and down the $2,900 – $2,550 range before closing in red at $2,590. The trading volumes were not high enough to ensure a reversal to the upside. What is more, bears were using both the dynamic resistance in the form of the leading EMAs and the horizontals to establish sell walls.
The Tuesday session was no different and ETH dropped further to $2,300 during intraday. However, the lower boundary of the long-term corridor provided the required stability and the price retraced back up to the $2,500 support at the daily close.
The third day of the workweek came with another re-test of the support area. Buyers were prepared this time and managed to push the price a little higher to close the day at $2,600.
The move did not last long and appeared to be just a fake breakout attempt. On Thursday, the ETH/USD pair renewed its downward movement by losing the support zone and eventually closing at $2,470.
The Friday session brought a second consecutive day in red for ETH and a new monthly low of $2,354. What is more important is that for the first time in this bull run we had a candle close on the daily chart below the long-term uptrend corridor.
The weekend of June 12-13 started with a flat session on Saturday and price fluctuations in the $2,250 – $2,450 area.
Then on Sunday ETH rallied 5.5 percent and re-entered the uptrend corridor, stabilizing near $2,500.
Top 10
- Litecoin (LTC)
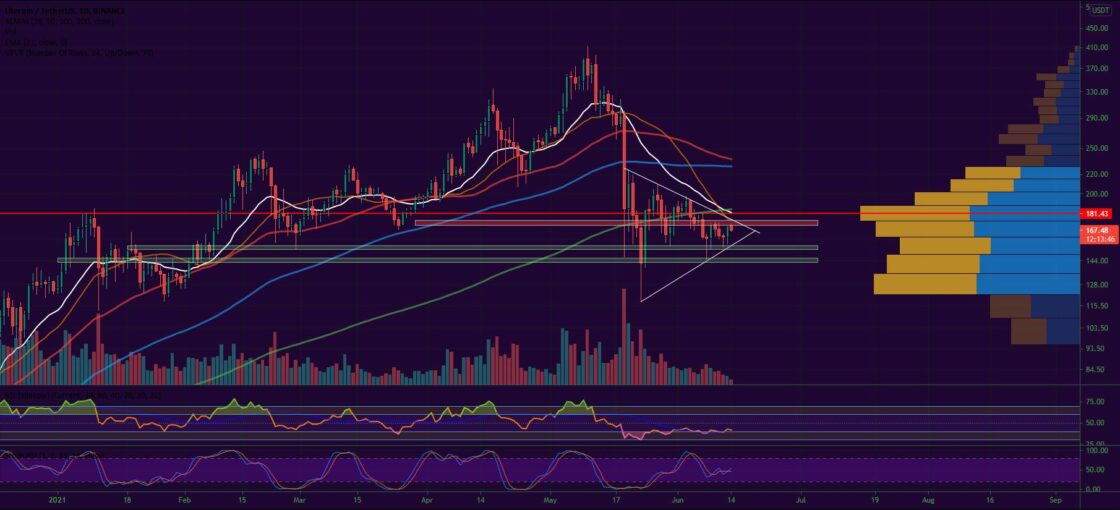
It is hard to find a top gainer in the current market conditions, but Litecoin (LTC) was one of the least impacted by the continuing selloff.
The coin limited its losses to just 3.1 percent as it found solid support in the $145 zone, which was also the point of stability during the severe market crash in mid-May. Back then LTC erased 71 percent and visited the sub-$120 levels for the first time since the end of January 2021.
Now bulls will be looking to keep the price floating above the newly established local uptrend line and try to reverse the trend by surpassing the $170 mark where the main selling activity is currently taking place.
The $155 and $145 are the next support levels we will be looking at.
Altcoin of the Week
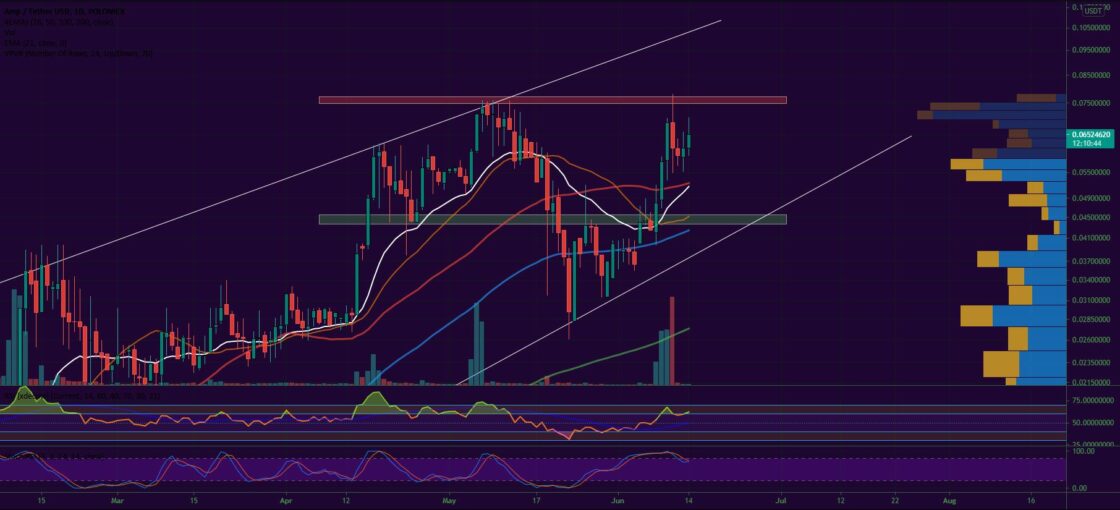
Our Altcoin of the week is Amp (AMP). Literally one of the ten coins in the Top 100 list that managed to survive last week’s market correction, Amp was 38 percent up for the period. It is also 133 percent up since hitting a three-month low of $0.026 on May 23.
The Amp token is said to decentralize the trading risk for its users via its innovative extensible platform for collateralizing asset transfers.
The coin was listed for trading on the Coinbase platform on June 11, which is without a doubt the main reason behind the recent rally.
The main target in front of bulls is to surpass the solid resistance around the May peak – $0.075. We can clearly see from the chart that the Volume Profile’s Point of Control is also situated in that area, which means an increased trading activity (probably selling activity) once the price lands in the zone around it. The next stable support is around $0.045.
As of the time of writing Amp is ranked at #37 on CoinGecko with a total market cap of $3.1 billion. The AMP/USDT pair is trading at $0.065.