Bitcoin, Ether, Major Altcoins – Weekly Market Update June 6, 2022

The cryptocurrency market added $25 billion to its market cap in the last seven days and now stands at $1.29 trillion. The top 10 coins were mostly in green for the same time period with Cardano (ADA) leading the group with a 32 percent of increase. Bitcoin (BTC) is currently trading at $31,470 while ether (ETH) is at 1,907.
BTC/USD
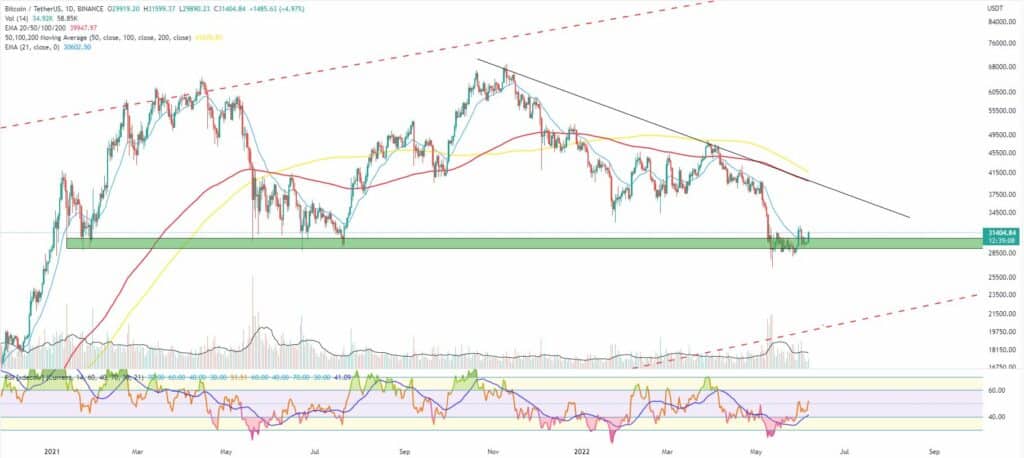
Bitcoin closed the trading day on Sunday, May 29 at $29,471 in its second consecutive day in green after once again confirming its short-term bottom right above the $28,500 horizontal support. The biggest cryptocurrency has been trading in the 31,300 – $28,500 range since May 10. It is worth noting that it formed its ninth red candle on the weekly chart in a row for the first time in its history erasing 2.9 percent for the last period.
However, on Monday, May 30 bulls continued to push in the upward direction as the BTC/USDT pair reached $31,807, surpassing the 21-day EMA and breaking above the upper boundary of the above-mentioned range. The trading volumes were still increasing slowly while the Relative Strength Index (RSI) moved out of the oversold area, still in a bullish divergence.
BTC remained flat on Tuesday as buyers were getting ready for consolidation before the next leg up. Or at least that was their expectation. Bears had a different thing in mind and on the mid-week session on Wednesday, they took control over the short-term price action by pushing the price 7.7 percent down to the $29,300 area during intraday and below the 21-day EMA.
The coin stopped at $29,800 at the daily candle close ending the month of May with a 15.3 percent loss.
On Thursday, June 2 we witnessed a relatively low volatility session during which BTC climbed up to 2.5 percent up to $30,500 right below the 21-day EMA.
The trading day on Friday was when bears came back in again and forced a full retrace of the previous day’s pump. The most popular cryptocurrency was now caught below bought the horizontal and dynamic resistances.
Bitcoin stayed more or less flat during the weekend of June 4-5 although it was slowly building its way up. It ended the seven-day period with a 1.6 percent increase.
As of the time of writing this market update the BTC/USDT pair is trading significantly higher – at $31,400 and above all mentioned resistances. It is 5.3 percent up for the day.
ETH/USD
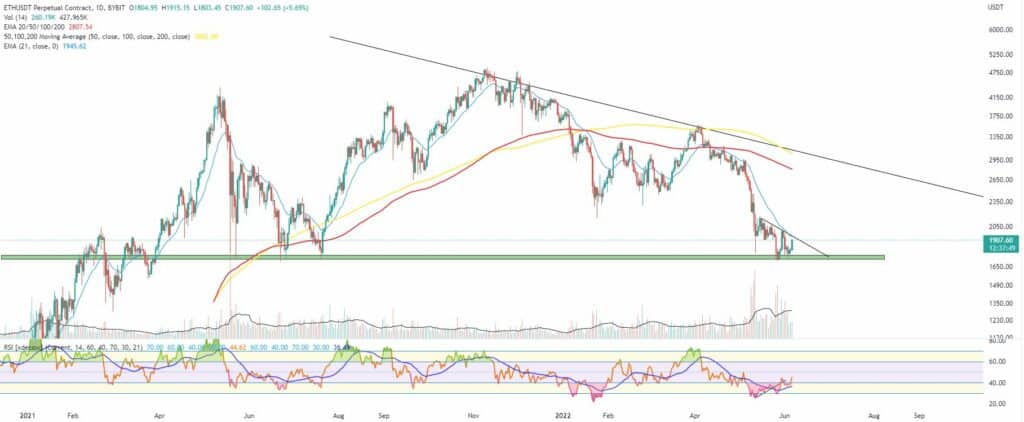
The Ethereum Project token ETH bounce back up from the extremely stable horizontal support in the $1,700-$1,750 area during the weekend of May 28-29 and on Sunday it reached $1,812. This however could not help it avoid yet another red weekly candle as the ether lost 11.4 percent for the period and approached its macro support levels.
On Monday, May 30, the ETH/USDT pair climbed 10 percent up to reach the $2,000 mark below the 21-day EMA. We could see a classic bullish divergence with the RSI on the daily timeframe chart which allowed the leading altcoin to temporarily reverse the trend direction.
The Tuesday session was slightly different and the coin corrected its price down to $1,944 closing the monthly candle with a 28.4 percent loss.
On the third day of the workweek, bulls could not reclaim the psychological level of $2,000 and we saw ETH falling sharply to $1,817 or 6.6 percent lower.
On Thursday, June 2 the coin remained flat above the horizontal support, but the trading volumes across all pairs were quite low suggesting a continuation of the downtrend. Still, the chance for a relief rally could not be fully ignored given the extremely high selloff in the last weeks.
Bears tested the support once more on Friday and the ether formed a red candle to $1,775, losing another 3 percent of its market cap.
The first day of the weekend came with a successfully short-term reversal attempt from buyers. The 24h-hour volumes were low but they were more than enough for the ETH/USDT pair to draw a small green candle on the daily chart.
On Sunday, the coin remained relatively stable around the same price level. However, this helped it also remain flat for the week.
What we are seeing midday on Monday is a solid 6 percent jump to the zone above $1,900.
Leading Majors
- Cardano (ADA)
We will be once again talking about Cardano as the coin continues to seriously outperform the rest of the altcoins on the Top 10 list.
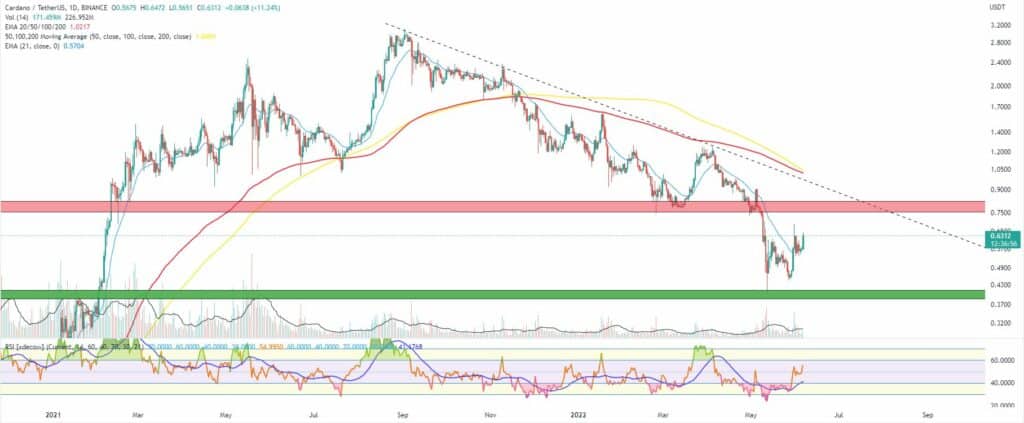
Last week we analyzed how ADA hit a 15-month low re-visiting the 2017/2018 high. The $0.6 zone above the 21-day EMA was acting as horizontal resistance on the daily chart and now we can see that after a short consolidation in a bull pennant formation, the ADA/USDT pair was finally able to surpass the $0.6 mark.
It is currently trading at $0.63 or 32 percent higher than last week’s open price.
Next for Cardano will be to extend the uptrend to $0.8 where the next major area of interest is situated on the daily timeframe chart then try to break also the diagonal downtrend line.
Altcoin of the week
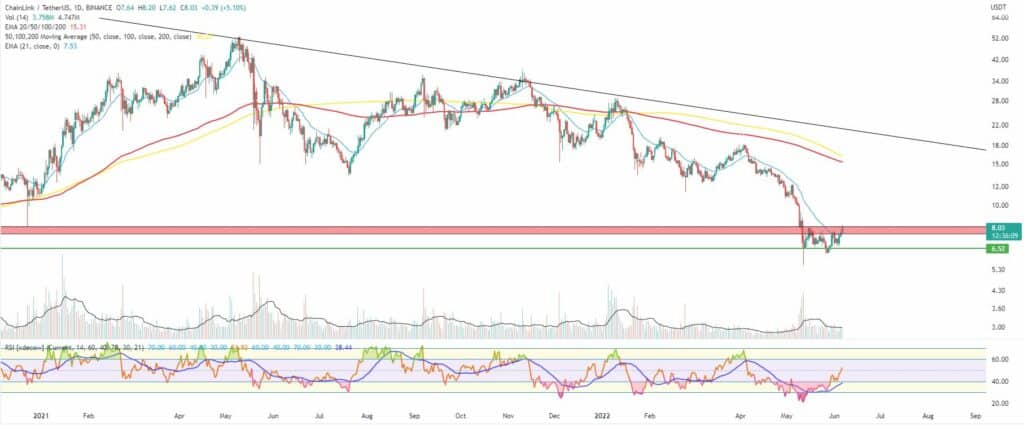
Our Altcoin of the week is Chainlink (LINK). The most popular blockchain data oracle is once again on the move as it was the case during the last bear market when most of the major altcoins were seeing new lows while at the same time the LINK/USDT pair was moving in the upward direction.
The Chainlink oracles help blockchain nodes safely connect to the off-chain world making it absolutely critical for all DeFi protocols which want to be fed with the most actual data from the outside world.
The LINK token added 15 percent to its valuation for the last seven days after bouncing from a 10-month low at $5.5. It is still trading below all major supports and the 21-period EMA on the weekly timeframe. Bulls will be trying to surpass the previous support zone situated around $7.5-$8, which is now acting as resistance right above the 21-day EMA.
Potential support at $6.5.
LINK is currently ranked at #23 on CoinGecko with a total market cap of approximately $3.7 billion.
